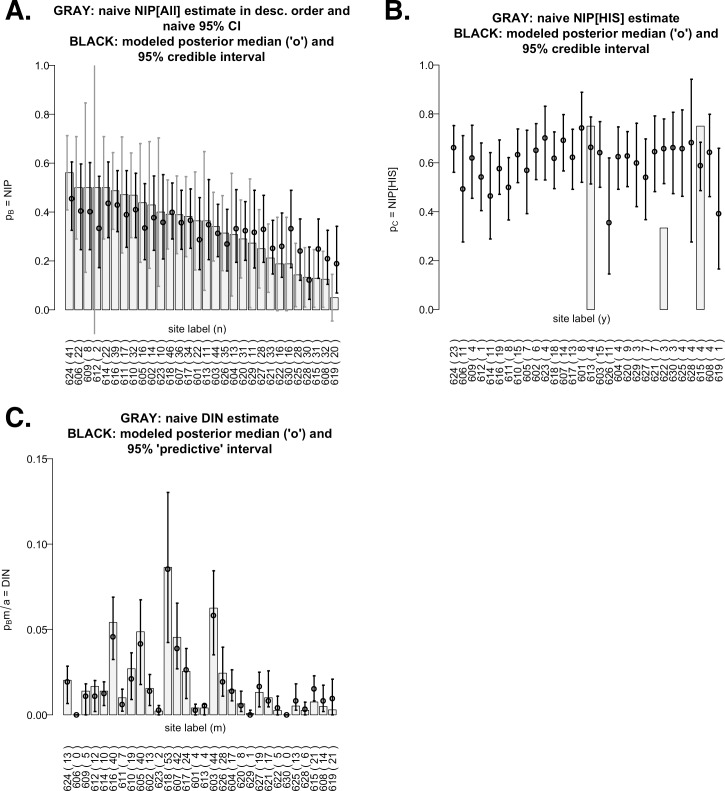
Fig 1.
Graphical displays of 2006 raw data and modeled results of overall nymphal infection prevalence (NIPAll; panel A), NIPHIS (panel B), and overall density of infected nymphs (DINAll; panel C). All bar charts are ordered by descending values on the x-axis. A: Shown as gray bars are the thirty site-specific naïve NIPALL estimates (= y/n where n = # of test ticks; y = # of ticks which tested positive for B. burgdorferi) and each corresponding naïve 95% confidence interval (= y/n ± 1.96 SEnaïve(y/n) based on sample proportions, also in gray) for the true NIPAll (= pB) at that site. In contrast, each black interval is a 95% credible interval (Bayesian confidence interval) using the posterior inference from our Bayesian model. Superimposed on each credible interval is the posterior median (a Bayesian estimate of the site’s true NIPALL). B: Same as panel A but for conditional NIPHIS estimates (= h/y where h = # of ticks whose RLB procedure indicated HIS+; RLB failure on any of the y positive ticks would lead to an indeterminate h/y). Only three sites yielded complete RLB results; their naïve confidence intervals were not computed due to small ys (hence, an invalid SE formula). In contrast, our Bayesian model provides valid estimates and 95% credible intervals for the true NIPHIS (= pC) for all 30 sites (shown in black). C: Similar to panels A–B but for naïve DINAll estimates (= [m/a]x[y/n] where m = # of nymphs dragged over a distance of a) and model-based estimates (= [m/a] x [posterior inference for pB]). Due to the uncertainty in m (unreplicated and hence, unmodeled), our model-based inference for DINAll here should be interpreted with care (see S4 File).

