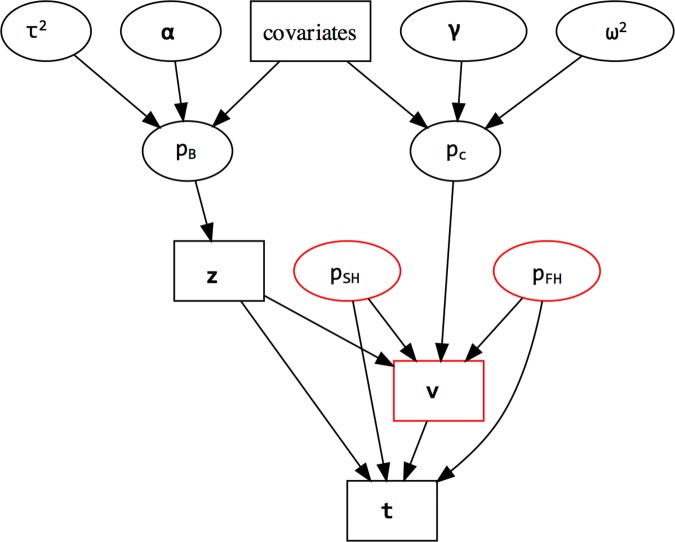
Fig 4. Visual representation of the integrative Bayesian hierarchical approach, upon which our GLM is constructed.
All quantities depicted are site-specific except for regression coefficient vectors (α,γ) and variance parameters (τ2,ω2) which are study- (year-) specific. Both pB and pC depend on the same covariates. These two sets of dependencies are integrated through (1) the direct collective influence of pc,pSH, and pFH, and z (vector of 1’s and 0’s denoting the state of B. burgdorferi infection for test ticks), on v (vector of 1’s and 0’s denoting success/failure of RLB tests), and (2) the direct collective influence of pSH,pFH, z, and v on t (vector of 1’s and 0’s denoting HIS presence/absence on test ticks). Model parameters are in ovals and data are in boxes. Red nodes are not modeled for the 2009 data because v ≡ 1 (non-stochastic). Model statements and details of the statistical analyses appear in S4 File.

