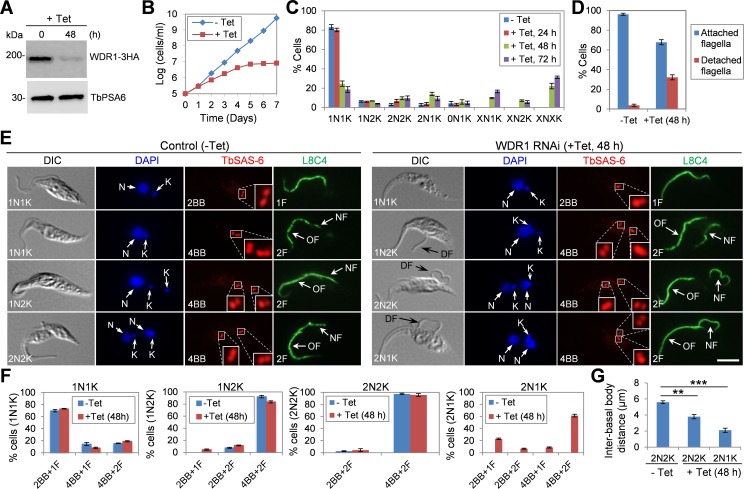
Fig 4. WDR1 depletion inhibited basal body segregation and caused flagellum detachment.
(A). Western blotting to monitor the level of WDR1-3HA, which was endogenously tagged in the WDR1 RNAi cell line, before and after tetracycline induction of WDR1 RNAi. The level of TbPSA6 was included as the loading control. (B). RNAi of WDR1 caused a severe growth defect. Cells harboring the WDR1 RNAi construct were incubated with (+Tet) or without (-Tet) tetracycline and counted every day for 7 days. Shown is the result from one of the four clonal RNAi cell lines that target two different sequences of the WDR1 gene. (C). Quantification of cells with different numbers of nucleus (N) and kinetoplast (K) before and after WDR1 RNAi. 200 cells were counted for each time point. Error bars represent S.D. (D). Percentage of cells with attached or detached flagellum before (-Tet) and after (+Tet) WDR1 RNAi induction for 48 h. 200 cells were counted from each time point, and error bars represent S.D. (E). Effect of WDR1 depletion on basal body segregation and flagellum attachment. Cells were immunostained with anti-TbSAS-6 pAb and L8C4 (anti-PFR2 mAb) to label the basal body (BB; including mature BB and pro-BB) and the flagellum, respectively. Black arrows in the DIC channel indicate the detached flagellum (DF). Scare bar: 5 μm. (F). Quantification of basal body (BB) and flagellum in non-induced control (-Tet) and WDR1 RNAi cells (+Tet, 48 h). 200 cells of each cell type were counted, and error bars indicate S.D. (G). Inter-basal body distances of 2N2K and 2N1K cells before and after WDR1 RNAi. WDR1 RNAi was induced for 48 h, and non-induced control and WDR1 RNAi cells were immunostained with YL 1/2 and anti-TbSAS-6 antibodies. Distance between the two pairs of mature basal body/pro-basal body was measured with the ImageJ software. 200 cells of each cell type from control and WDR1 RNAi were counted, and error bars indicate S.D. from three independent experiments. Statistical analysis was performed using t-test in Excel. **, p<0.01; ***, p<0.001.

