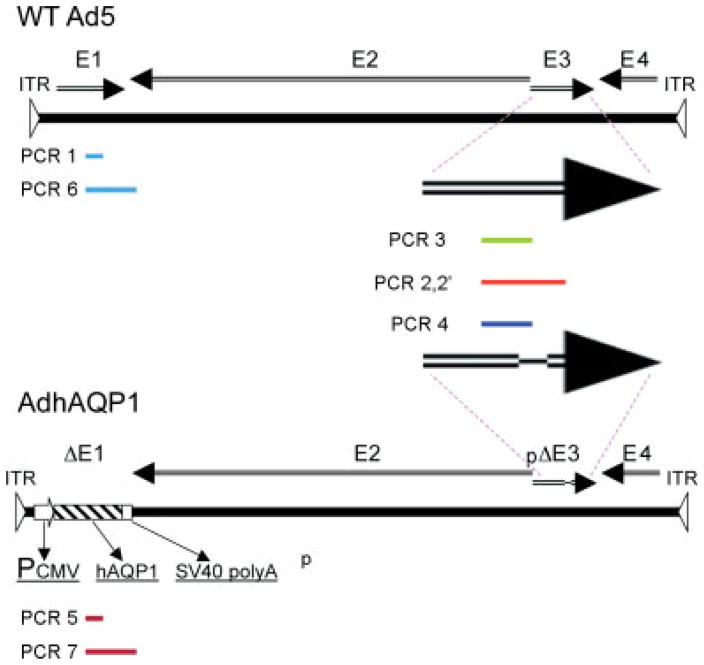
Figure 1.
Schematic representation of the PCR products studied. Linear representations of the WT serotype 5 adenovirus (WT Ad5) genome and the AdhAQP1 genome are shown. Arrows indicate different genomic regions. The PCR products studied, and their locations, are shown as bars in different colors. The two large arrows show the regions amplified in the Ad5 E3 region. For details of the primers used and PCR reaction conditions, see Materials and methods. Additional information on the sequence of the PCR products is provided in Table 2 and Figure 3

