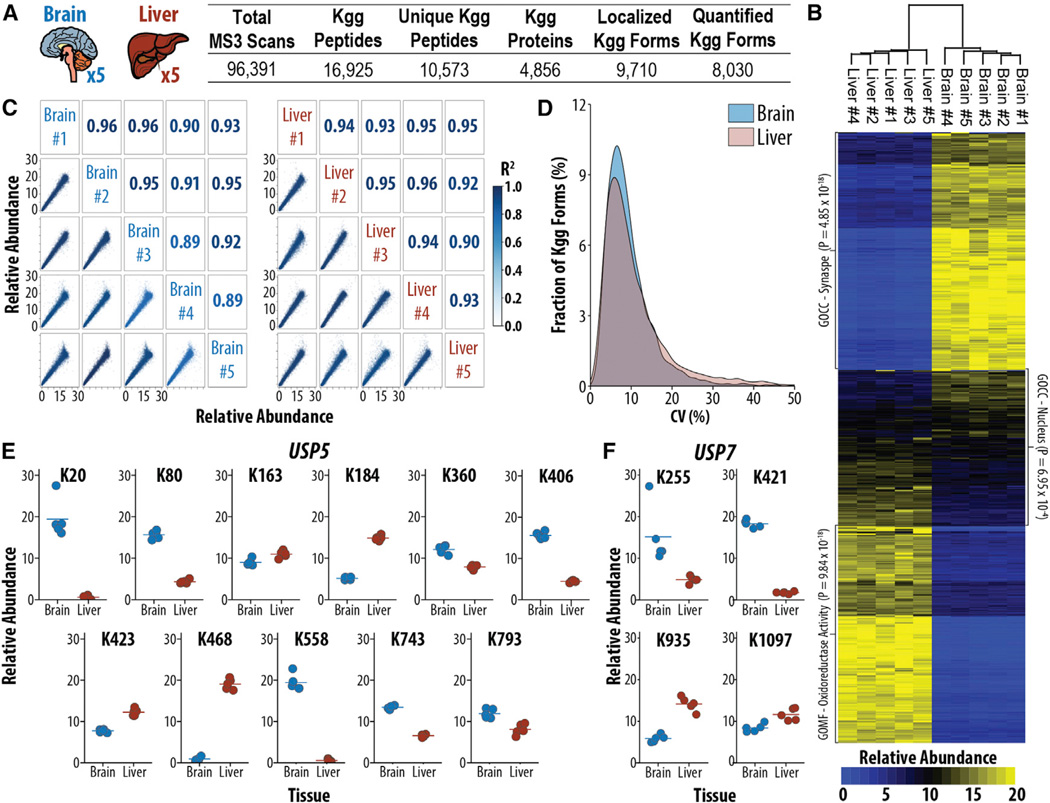
Figure 2. Multiplexed Ubiquitylome Analysis Reveals Tissue-Specific Ubiquitylation Events on Key Proteins in the UB-Proteasome System.
(A) Experimental design and summary statistics for the analysis of ubiquitylation in biological replicates of mouse brain and liver (n = 5) are shown.
(B) Global differences between brain and liver for protein normalized ubiquitylation abundances are shown.
(C) Correlation of biological replicates in each tissue. R2 values are displayed with color corresponding to the degree of correlation.
(D) CV (n = 5) for either brain or liver biological replicates is shown.
(E and F) Protein normalized ubiquitylation quantification for USP5 (E) and USP7 (F) reveals tissue-specific ubiquitylation events.

