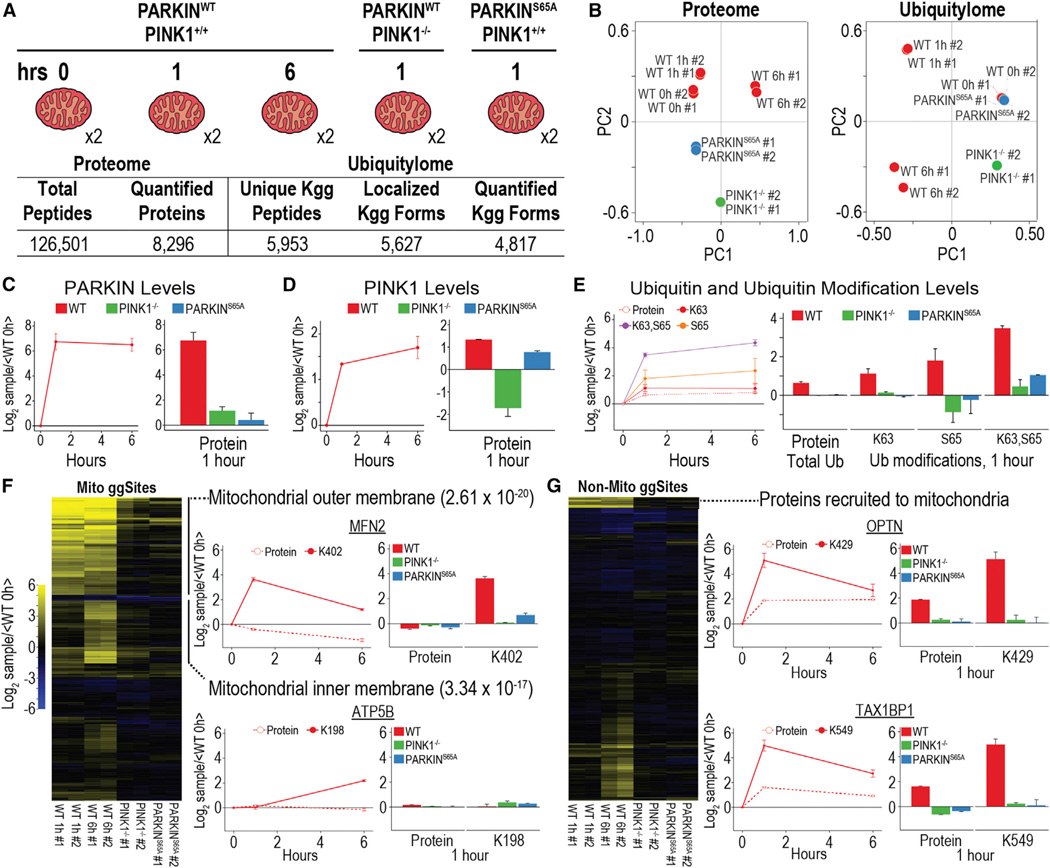
Figure 4. Proteome and Ubiquitylome Dynamics of Enriched Mitochondria Undergoing Mitophagy.
(A) Experimental design and summary statistics of proteome and ubiquitylome analysis are shown.
(B) Principal-component analysis for proteome and ubiquitylome data is shown.
(C and D) PARKIN (C) and PINK1 (D) protein expression during mitophagy for three time points in WT cells and one time point in PINK1−/− and PARKINS65A cells is shown.
(E) Expression levels for total levels of UB protein and modifications of UB, including K63 ubiquitylation, S65 phosphorylation, and a form of UB containing both modifications, are shown.
(F) Hierarchical clustering for ubiquitylation forms belonging to mitochondrial proteins. Protein and ubiquitylation expression for mitochondrial outer (MFN2) and inner membrane (ATP5B) proteins is shown.
(G) Hierarchical clustering for ubiquitylation forms belonging to non-mitochondrial proteins. Protein and ubiquitylation expression for proteins recruited to the mitochondria during mitophagy (OPTN and TAX1BP1) is shown.
All points and bars represent the mean ratio for biological replicates (± 1 SD).

