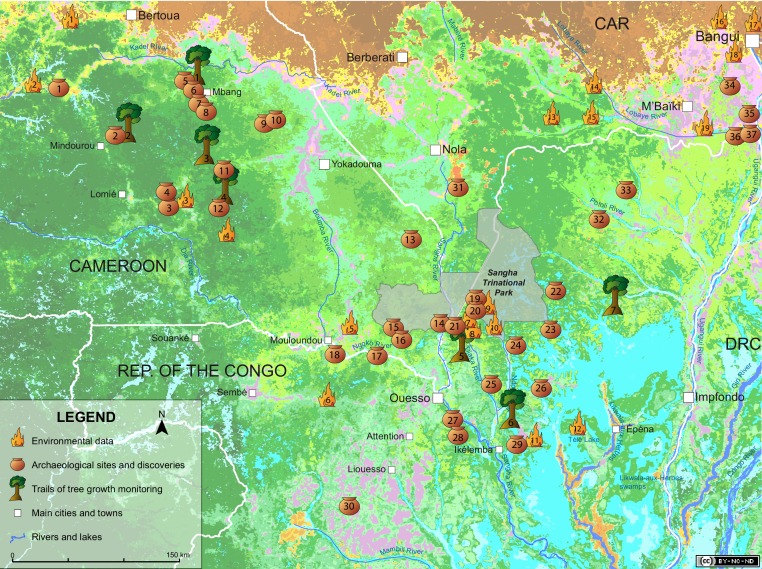
Figure 1. Paleoenvironmental changes and human activities in the Sangha River Interval.
The 34 sites with paleoenvironmental data (fires) and the 38 dated archaeological sites and discoveries (pots) are indicated on a vegetation map modified from Gond et al. (2013) (http://www.coforchange.eu/products/maps). The seven sites used to monitor tree growth (trees) are also indicated (see Supplementary files 4, 5 and 6 for site names). Brown (three shades): savanna of the Sudano-Guinean domain; orange (three shades): savanna included in dense forest; yellow: savanna-forest edge; purple (two shades): very open forest; blue-green: open semi-deciduous forest; medium green (three shades): dense semi-deciduous forest; dark green (five shades): dense evergreen forest; light green (two shades): open evergreen forest; light blue (two shades): swamp forest and swamp. Map: QGIS 2.14 (http://www.qgis.org), CAD: Illustrator CS4 (https://www.adobe.com).

