. 2016 Dec 30;5:e17280. doi: 10.7554/eLife.17280

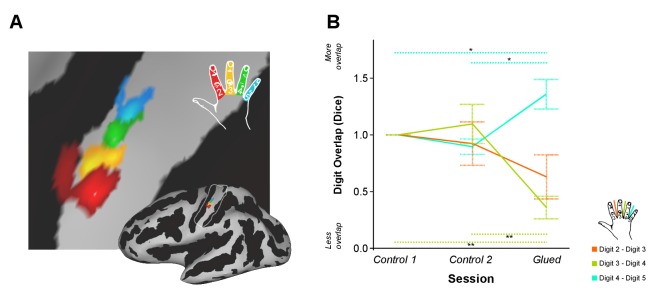
Figure 1. Patterns of rapid experience-dependent remapping in human SI.

(A) An example digit map from an individual participant and session, shown on an inflated brain surface (bottom right), and a zoomed panel (Threshold FDR α = 0.01); sulci and gyri are shown in dark and light grey, respectively. The region of interest used for cortical overlap analysis is indicated by a white line on the inflated brain. (B) Cortical overlap between pairs of digit representations showed a significant reduction between D3 and D4, and a significant increase between D4 and D5 after the gluing manipulation compared with the two control conditions. *p<0.05 **p<0.005 Sidak corrected. Data in (B) are presented normalised to control one session; all statistics were performed on raw un-normalised data. Dice: Dice coefficient; Error bars represent standard error of mean.

DOI: http://dx.doi.org/10.7554/eLife.17280.003

Figure 1—source data 1. Data presented in Figure 1B.
DICE coefficients representing digit overlap for three digit pairs (D2–D3, D3–D4 and D4–D5) across three conditions (Control 1, Control 2 and Glued).
DOI: 10.7554/eLife.17280.004

Figure 1.

Figure 1—figure supplement 1. Cortical surface area of individual digit representations used in calculation of DICE coefficient at each time point.
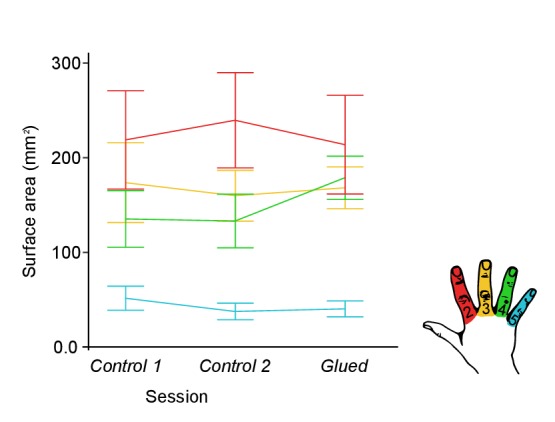
Figure 1—figure supplement 1.

No significant change in cortical digit surface area was observed across the three time points under study (Control 1, Control 2 and Glue); two-way repeated measures ANOVA indicated no significant interaction between session and digit on the surface area (F(6,48) = 1.259, p=0.294, η2:. 136).

Figure 1—figure supplement 2. Overview of the fMRI experiment and the behavioural experiment study design.
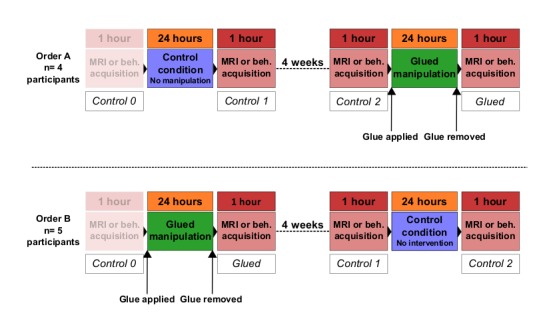
Figure 1—figure supplement 2.

The order of conditions was counterbalanced across participants, resulting in four participants experiencing the control period first (Order A; top row), and five participants experiencing the gluing manipulation first (Order B, bottom row). Control 0 was treated as an habituation session and was not included in the analysis. Beh: behavioural testing.

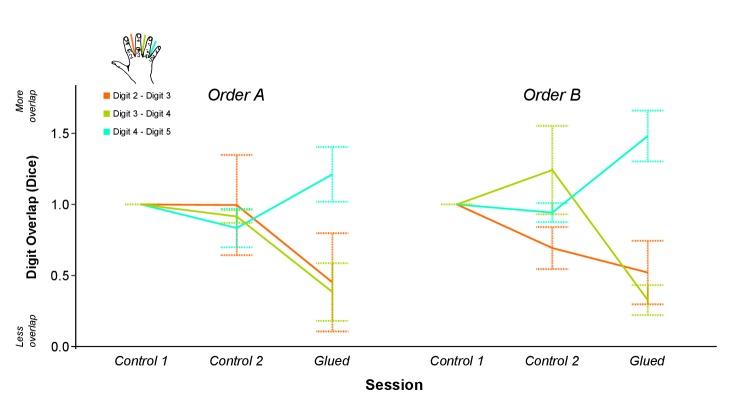
Figure 1—figure supplement 3. Data presented in Figure 1B split according to the order of sessions.

Figure 1—figure supplement 3.

(A) Order A (Control 1 separated by 4 weeks from Control 2 and Glued): n = 4; Order B (Glued separated by 4 weeks from Control 1 and Control 2), n = 5.