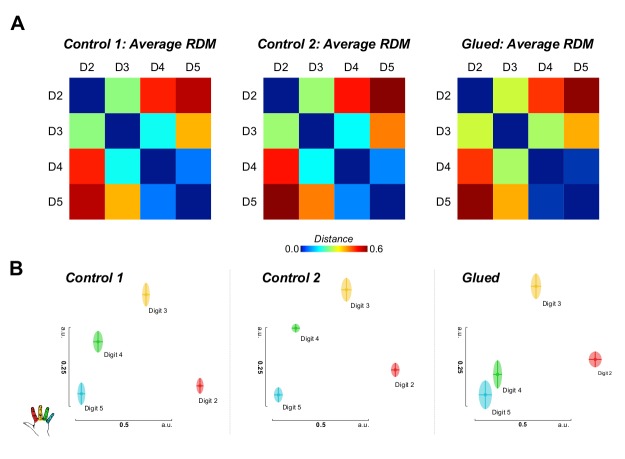
Figure 3. Representational similarity analysis of block design data yields complementary evidence of shift in the S1 representation of digit 4 away from digit 3 and towards digit 5.
(A) Noise normalised parameter estimates from a standard GLM for each digit were used to construct representational dissimilarity matrices (RDMs) using Euclidean distance within a hand knob ROI derived individually for each subject from phase-encoding data from all sessions. Average raw distance values are shown for each session (B) Multidimensional scaling and Procrustes analysis of individual participants’ distance matrices at each time point demonstrate schematically the observed shift in the representation of digit 4, away from digit 3, and towards digit 5, consistent with the observed pattern of cortical overlap and tactile discrimination changes. Two-way repeated measures ANOVA indicated a significant interaction between session and digit pair on the amount of cortical overlap (F(2.0,16.2) = 4.430, p=0.029, η2:0. 356), driven by a shift in the representation of digit 4 away from digit 3 (Simple Main Effect: F(2,16) = 16.076; pairwise comparisons glued vs. control 1 and control 2: p<0.01). Multidimensional scaling yields the spatial relationship of representations in arbitrary units (a.u.).
DOI: http://dx.doi.org/10.7554/eLife.17280.009

