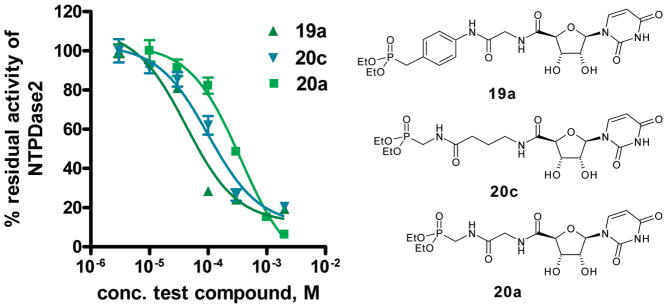
Figure 3.
Concentration–inhibition curves of selected inhibitors at NTPDase2. The enzyme assays were performed in a final volume of 100 μL using a substrate (ATP) concentration of 400 μM (Km = 70 μM). Product formation was determined by capillary electrophoresis as described in the Experimental Section. Data points represent the mean ± SEM from two separate experiments each performed in triplicate. Determined IC50 values were 42 μM (19a), 101 μM (20c), and 374 μM (20a). Calculated Ki values were 8.2 μM (19a), 29.2 μM (20c), and 71.7 μM (20a).

