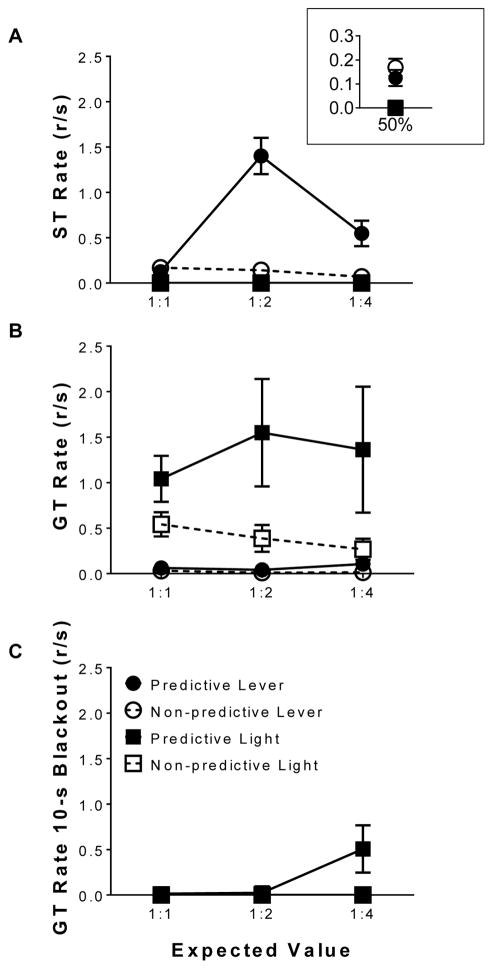
Fig. 3.
Response rates during the terminal-link averaged across the last four sessions of each phase. Mean (±SEM) response rates for (A) sign-tracking, (B) goal-tracking, and (C) responding during the absence of the predictive stimulus as a function of decreasing predictive to non-predictive alternative expected values (lever n = 6; light n = 6).

