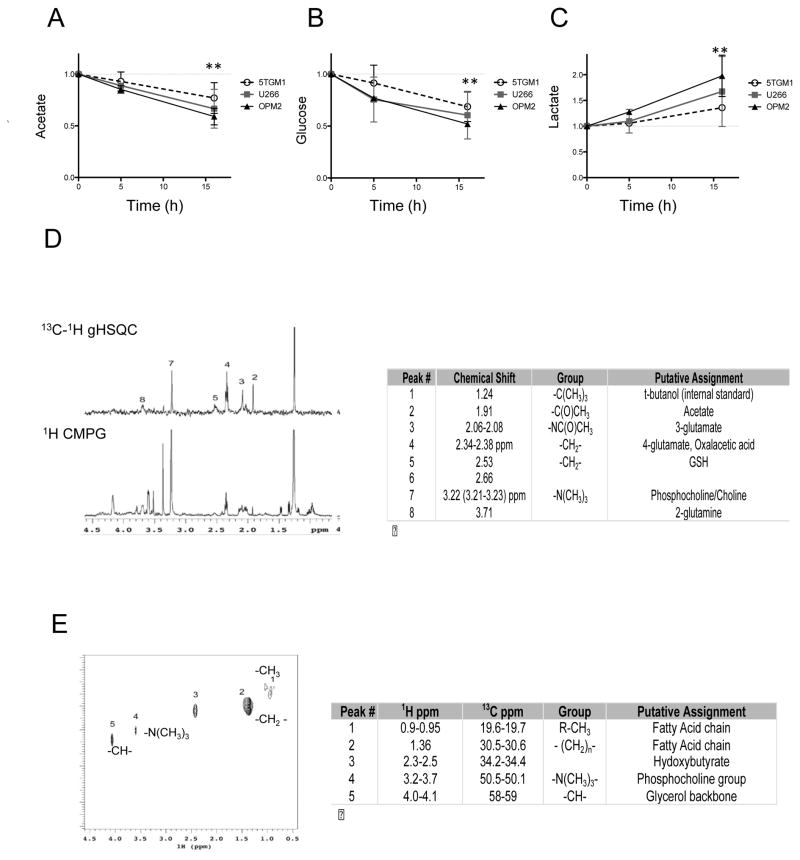
Figure 1. 13C-edited 1H-NMR shows metabolism of acetate by MMC and uptake of acetate from the extracellular environment.
A) 1H NMR (CPMG) analysis of acetate (1.91 ppm) in the conditioned media from MMC lines 5TGM1, U266, and OPM2, incubated for different times with 10mM acetate. B) Analysis of glucose (5.24 ppm), C) Analysis of Lactate (1.31–1.32 ppm). Acetate, glucose and lactate values are normalized by alanine (3-position at 1.5 ppm) and time 0. Average (dots) and standard deviation (error bars) of 2–3 biological replicates are shown per time-point per cell line, ** p<0.01 by two-way ANOVA.
D) Intracellular acetate metabolism assessment by metabolite fate tracking by NMR showing the 13C-1H gHSQC (gradient Heteronuclear Single Quantum Coherence, top) and 1H CPMG spectra from the same cellular extract of U266 human MMC incubated for 16h with 10mM 13C-acetate. Peak assignments (by number) and 1H chemical shift in the table on the right.
E) 2D 1H-13C HSQC of U266 chloroform extraction (membranes) after 70h incubation with 10mM 13C-acetate (chemical shifts and metabolite assignment in the table on the right).

