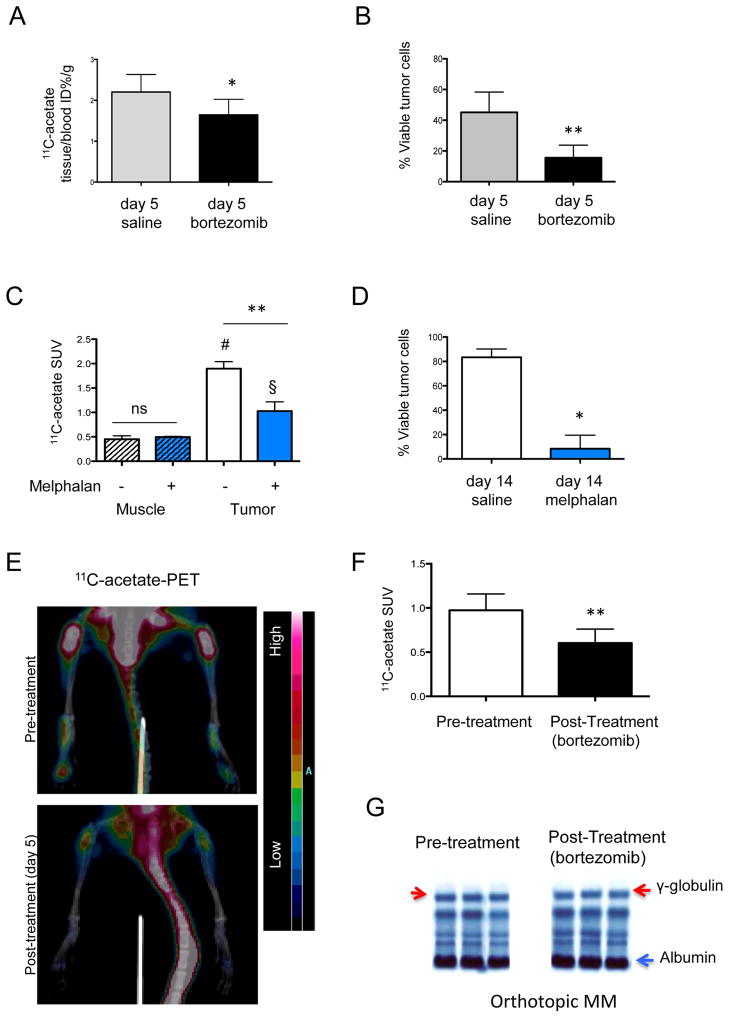
Figure 5. 11C-acetate uptake reports on response to bortezomib.
A–B) Tissue bio-distribution (A) 1h post 11C-acetate injection and ex-vivo tumor cell viability (GFP+ PI− cells, B) in KaLwRij mice with subcutaneous 5TGM1 tumors, on day 5 of treatment with saline (gray) or bortezomib (day1–day 4, 1mg/kg) C–D) 11C-acetate PET tumor and muscle SUV (C) and ex-vivo tumor viability (GFP+ PI− cells, D) in KaLwRij mice with subcutaneous 5TGM1 tumors treated for two weeks with vehicle (open bars) vs. melphalan (blue bars) (n=2/group) C-acetateANOVA and Tuckey’s post-hoc test p<0.01 for treated vs. untreated tumors (**), p<0.01 for muscle vs. untreated (#) and p<0.05 vs. remaining treated tumor (§).C-acetateE) 11C-acetate PET/CT of a representative orthotopic 5TGM1 MM-bearing KaLwRij mouse before (top) and a day after (bottom, day 5) treatment with bortezomib, showing decreased bone uptake (see heat map scale) in the post-treatment scan on day 5 since the beginning of treatment with bortezomib. F) SUVs from the tibial ROI before and 5 days after treatment with bortezomib of 5TGM1 MM-bearing KaLwRij mice (n=3 mice, 6 total ROIs). G) Serum Protein Electrophoresis (SPEP) of three 5TGM1 MM-bearing mice prior to (left) and after (right) 5 days of treatment with bortezomib, showing the lack of increase, but presence of an identifiable monoclonal band in the γ-globulin region (red arrow). *p<0.05, ** p<0.01

