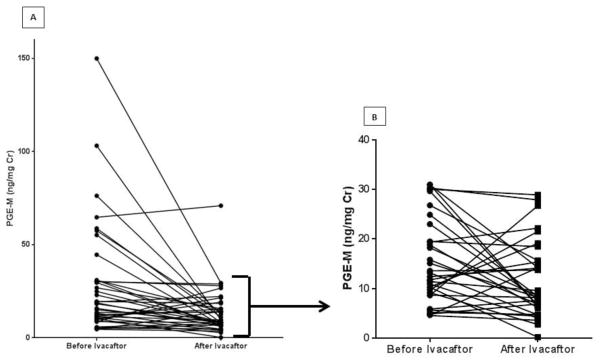
Figure 1. Urine Prostaglandin E Metabolite (PGE-M) Analysis.
(A) The change in urine PGE-M for all 40 participants before and after treatment with ivacaftor; p< 0.001 by Wilcoxon signed rank test. (B) The change in urine PGE-M before and after ivacaftor with the elevated outliers (n=8) removed; p<0.05 by Wilcoxon signed rank test.

