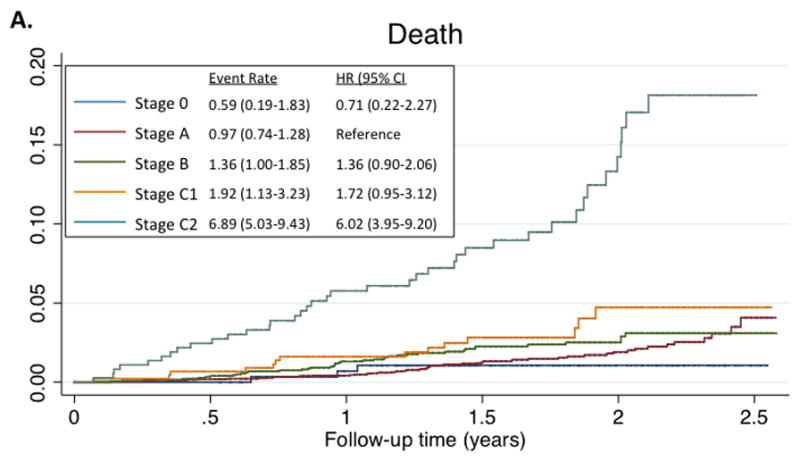
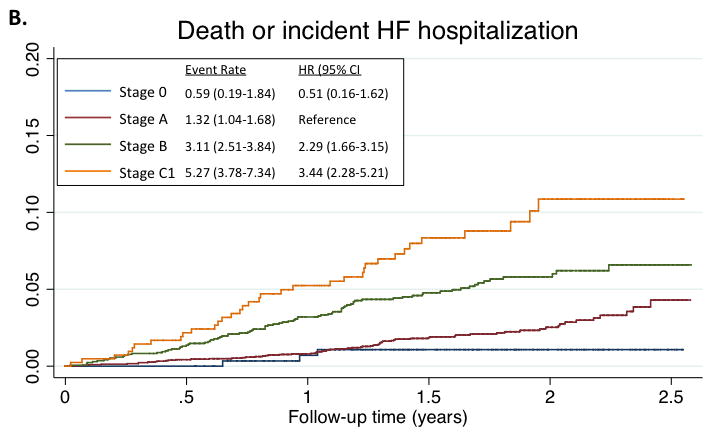
Figure 2.


Kaplan-Meyer survival curves for death (panel A), and the composite of death or HF hospitalization (panel B), by HF Stage. Median follow-up time for the composite endpoint was 608 days (25th to 75th percentile range 469–761 days). Total number of events was 194. For the composite endpoint, estimates for HF Stage C2 are not provided as all participants in this stage had, by definition, experienced a previous HF hospitalization. Event rate is expressed per 100 person-years. Hazard ratios are adjusted for age, sex, race, and Field Center.
