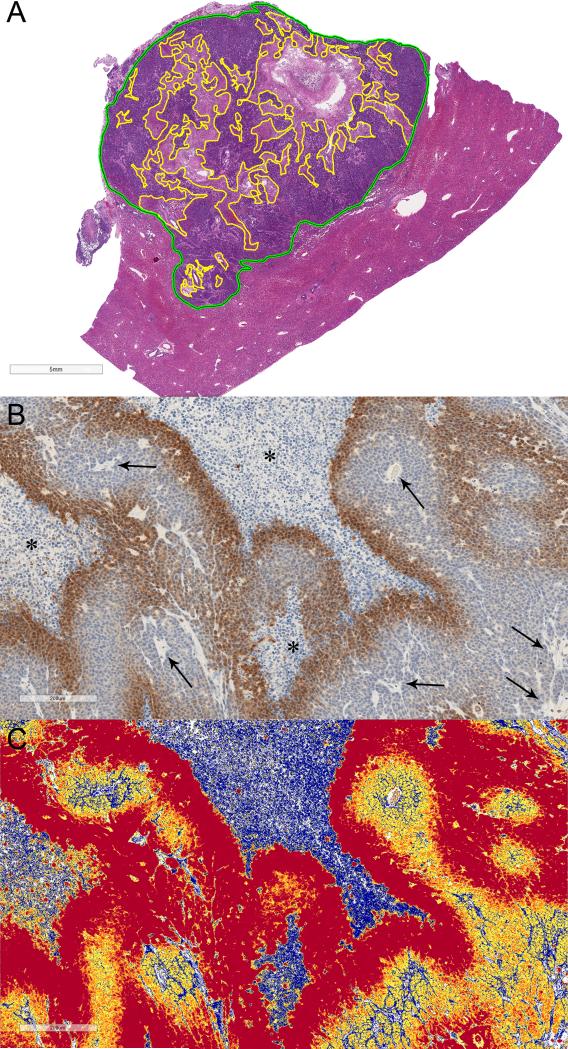
Figure 1.
A) Quantitative histosegmentation technique. Digitized tumor tissue section of a representative VX2 liver tumor. Manually-annotated whole tumor area (green outline) and necrotic areas (yellow outlines) were performed in contiguous tumor slides to obtain the necrotic fraction of the entire tumor. Scale bar = 5 mm. B) and C) Quantitative color deconvolution technique. B) Representative digitized image of tumor hypoxia detected by pimonidazole binding and C) corresponding pseudocolor deconvoluted image generated as an algorithm result (colormap). Scale bar = 200 μm. B) Dark brown staining outlining tumor necrotic areas (*) represents chronic hypoxia. Numerous tumor vessels are seen throughout the tumor (arrows). C) blue pixels = no staining, yellow pixels = weak positive, orange pixels = medium positive, and red pixels= strong positive. Strong positive pixels were considered to quantify each staining, whereas weak and medium positive pixels were assigned to the unstained background.

