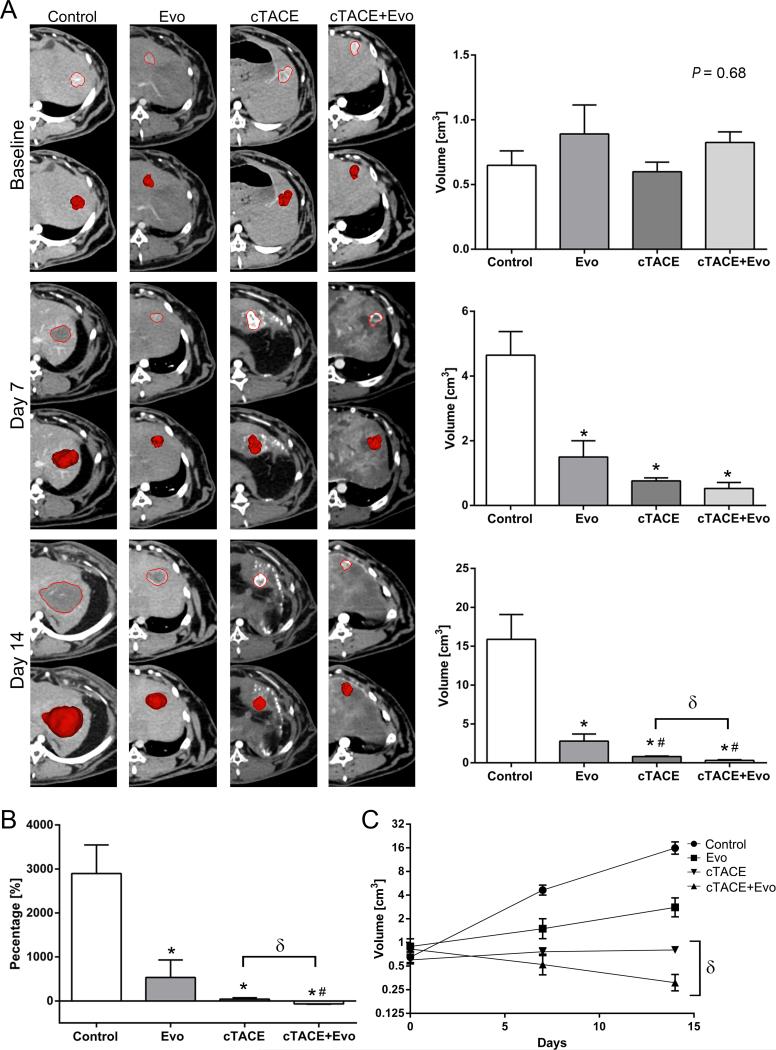
Figure 2.
Quantitative volumetric image analysis at baseline, 7 and 14 days after treatment with Evo (7.7 mg/kg, i.a on day 0), Lipiodol/doxorubicin (0.7 mg/kg, i.a on day 0) based-TACE, Evo (7.7 mg/kg, i.a on day 0) + Lipiodol/doxorubicin (0.7 mg/kg, i.a on day 0) based-TACE. A) Representative images of tumor segmentation mask and volume according to the groups (columns) and time points with respective graphs (rows). B) Tumor growth rate evaluated at day 14 compared to baseline. C) Linear regression analysis to illustrate tumor growth kinetics. Each bar represents mean ± SEM. * P < 0.05 versus control group. # P < 0.05 versus Evo group. δ P < 0.05 between chemoembolization groups.

