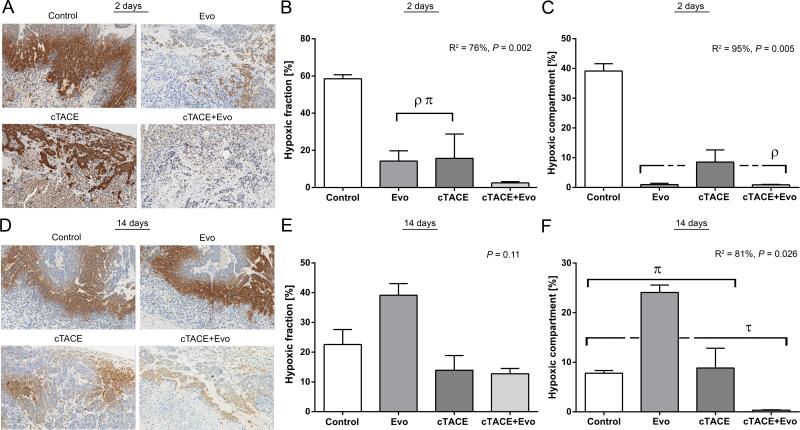
Figure 4.
Quantitative analysis of tumor hypoxia microenvironment changes by pimonidazole staining. A) Representative images of tumor hypoxia detected by pimonidazole binding in the 4 study groups at 2 days post selective intraarterial therapy (scale bar = 100 μm). B) Percentage of hypoxic fraction (pimonidazole-positive area in the viable tumor) 2 days post treatment. ρ P < 0.05 versus control group. π P < 0.05 versus cTACE+Evo group. C) Percentage of the hypoxic compartment (pimonidazole-positive area in the whole tumor area) 2 days post treatment. ρ P < 0.05 versus control group. D) Representative images of tumor hypoxia detected by pimonidazole binding in the 4 study groups at 14 days post selective intraarterial therapy (scale bar = 100 μm). E) Percentage of hypoxic fraction 14 days post treatment. F) Percentage of the hypoxic compartment 14 days post treatment. τ P < 0.05 versus Evo group. π P < 0.05 versus cTACE+Evo group. Each bar represents mean ± SEM.

