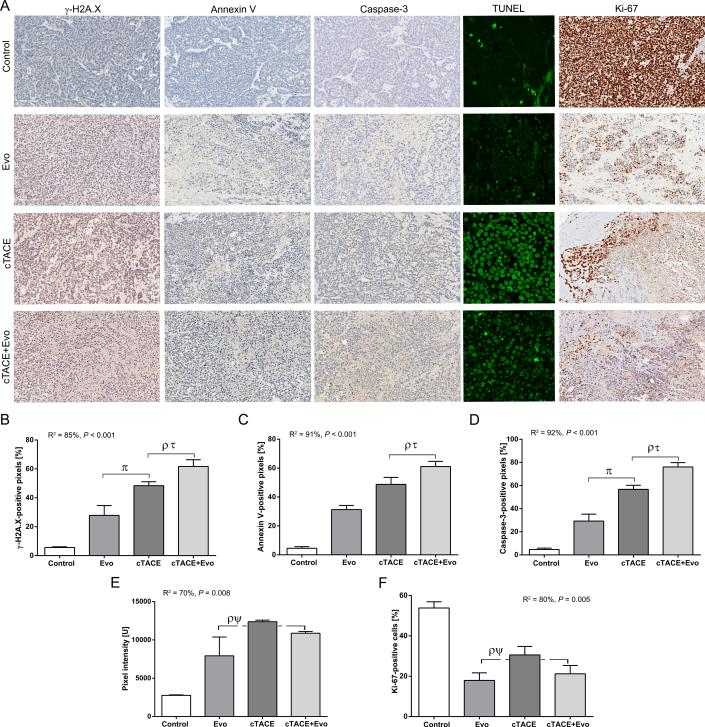
Figure 5.
Quantitative color deconvolution analysis of the expression of biomarkers of DNA damage, apoptosis and cellular proliferation and semi-quantitative analysis apoptosis using terminal deoxynucleotidyl transferase dUTP nick end labeling (TUNEL) performed 2 days post intraarterial interventional treatment. A) Representative images of the biomarkers γ-H2A.X, annexin V, caspase-3, Ki-67 at 20x magnification (scale bar = 100 μm) and TUNEL at 40x magnification. B-F) Respective biomarkers and TUNEL bar graphs as indicated below corresponding images. Each bar represents mean ± SEM. ρ P < 0.05 versus control group. τ P < 0.05 versus Evo group. π P < 0.05 versus cTACE+Evo group. ψ P < 0.05 versus cTACE group.

