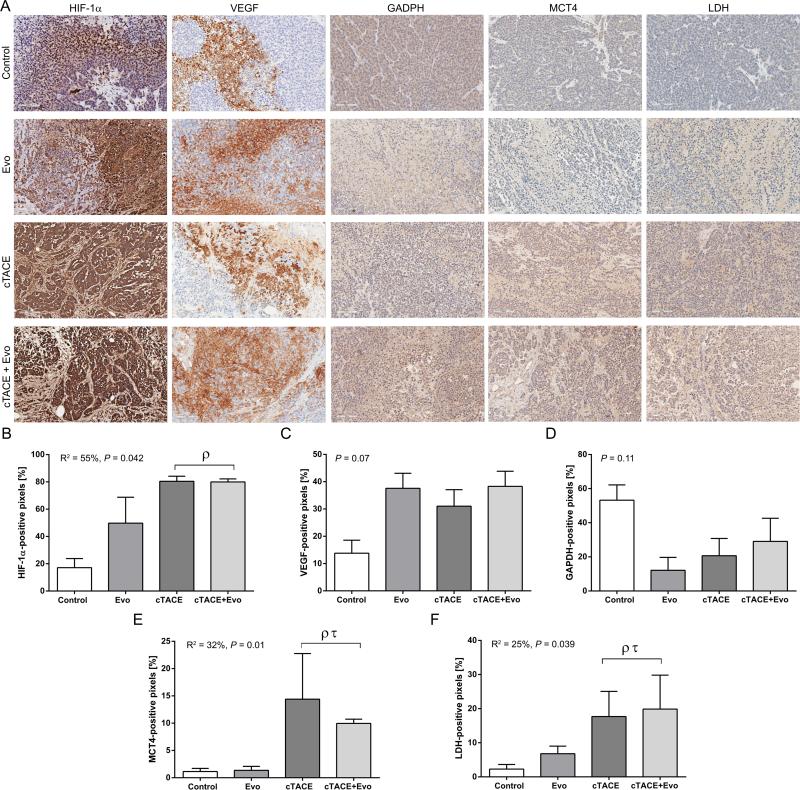
Figure 6.
Quantitative color deconvolution analysis of the expression of endogenous hypoxia and tumor glycolysis biomarkers performed 2 days post intraarterial treatment. A) Representative images of the biomarkers HIF-1α, VEGF, GAPDH, MCT4 and LDH at 20x magnification (scale bar = 100 μm). B-F) Respective HIF-1α, VEGF and glycolytic biomarkers bar graphs as indicated below corresponding images. Each bar represents mean ± SEM. ρ P < 0.05 versus control group. τ P < 0.05 versus Evo group.

