
Figure 4.
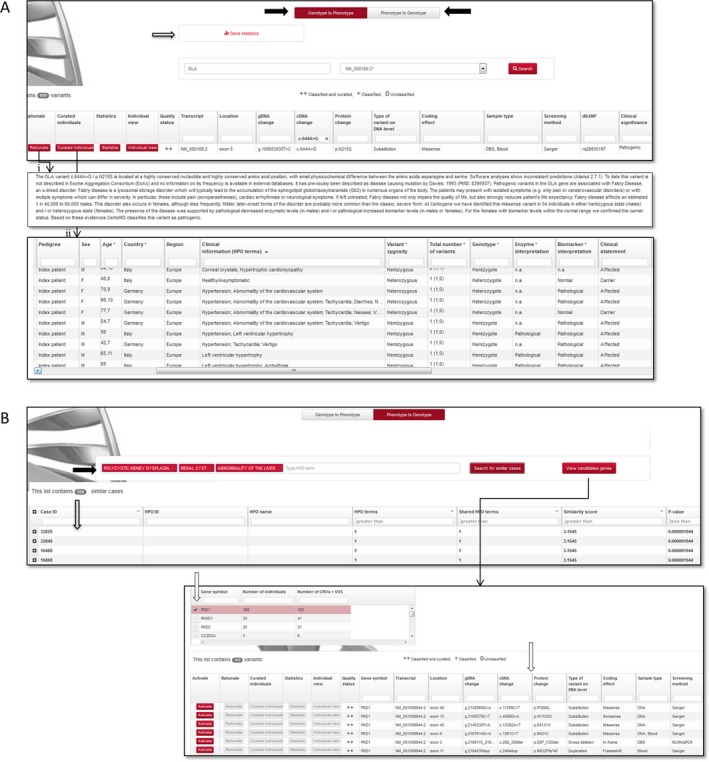
Viewing results in CentoMD database. A) GLA c.644A>G variant as displayed by the Genotype‐Phenotype module. Black arrows indicate the two search modules: Genotype to Phenotype and Phenotype to Genotype. The result table contains variant detailed information and four additional options: rationale (1), curated individuals; (2), statistics and individual view. Gray arrow: gene‐based statistics. B) Phenotype search using HPO terms: polycystic kidney disease, renal cysts, and abnormality of the liver, as displayed by Phenotype‐Genotype module. Black arrows indicate the search field using HPO terms. Gray arrow: table with similar cases. White arrow: candidate genes most likely explaining the clinical symptoms used to initiate the search. Arrow: result table of variants (CRV and VUS) identified in similar cases sharing the HPO terms used to initiate the search. By variant activation, rationale, curated individuals, statistics, and individual view are available for user.