Figure 2.

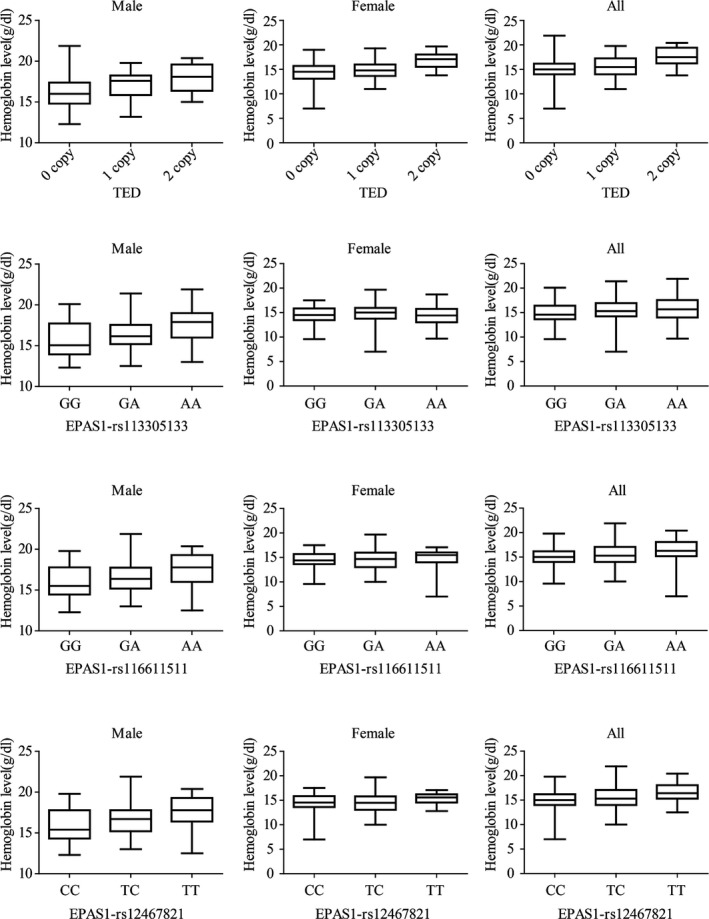
The box plot showing comparison of hemoglobin levels of different genotypes of TED and three EPAS1 SNPs (rs113305133, rs116611511, and rs12467821) in Sherpas.

The box plot showing comparison of hemoglobin levels of different genotypes of TED and three EPAS1 SNPs (rs113305133, rs116611511, and rs12467821) in Sherpas.