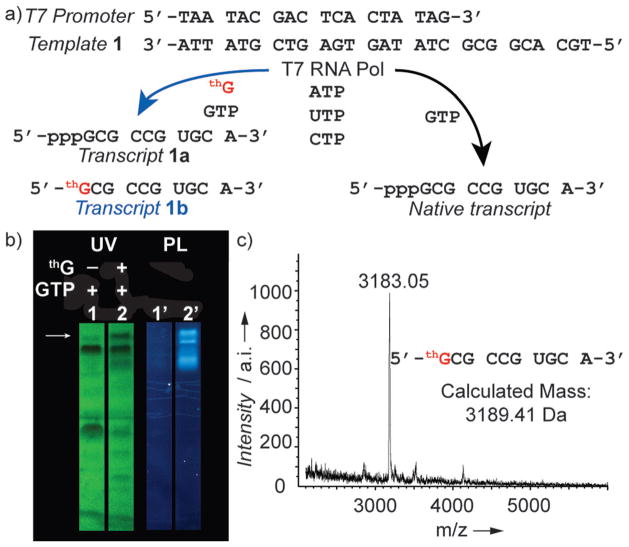
Figure 2.
Transcription reactions with template 1. a) T7 promoter and template 1 depicting the enzymatic incorporation reaction using natural NTPs with or without the presence of thG resulting in different transcripts. b) Transcription reaction using template 1 with 1 mM of all natural NTPs (lane 1 and 1′), 1 mM of all natural NTPs and 5 mM of thG (lanes 2 and 2′). The white arrow indicates transcript 1b (in lane 2). UV shadowing was observed at 254 nm, photoluminescence (PL) was observed at 302 nm. c) MALDI analysis of transcript 1 b.

