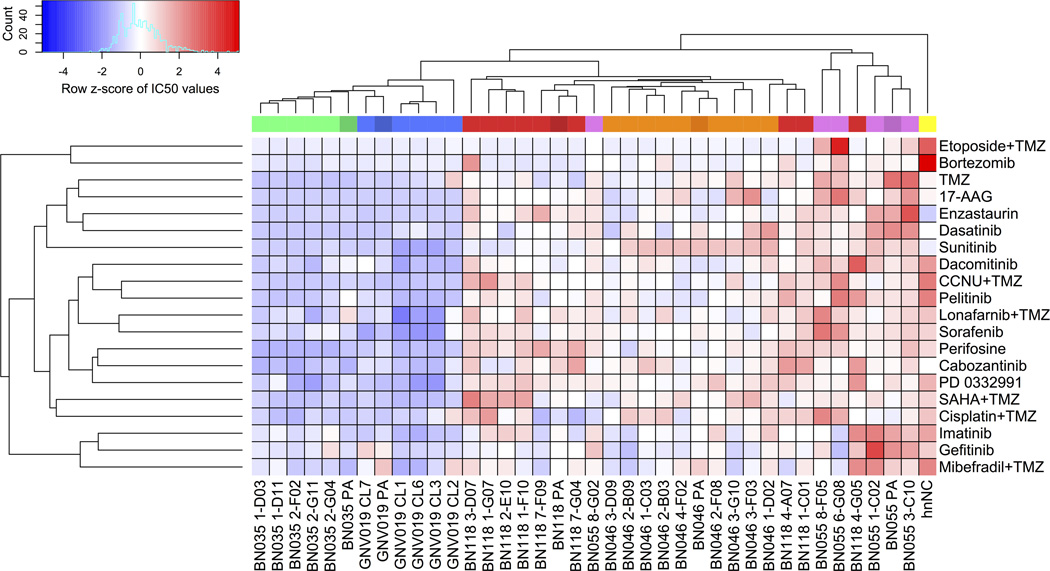
Figure 1.
Pilot data: drug response profiles of tumor subclones reflect intra- and inter-individual tumor heterogeneity. Unsupervised clustering of Z-score transformed IC50 data. Column color code identifies five glioblastoma cases, their respective parental cultures (i.e. one dark shade per color), and their respective subclones (light shades). Data matrix codes reflect low (blue) vs. high (red) IC50 values. Consistency of results was verified by correlating triplicate analysis of two individual library batches (R2=0.994). hnNCs are human non-malignant brain cells (see Materials and Methods). For individual results and drug/compound details, see Supplementary Fig. S1 and Table S2. Note considerable variability of inter-tumor (29/33 subclones grouped within their patient-specific cluster) and intra-tumor (4/33 subclones even presented as outliers clustering ‘trans-individually’) drug responses.

