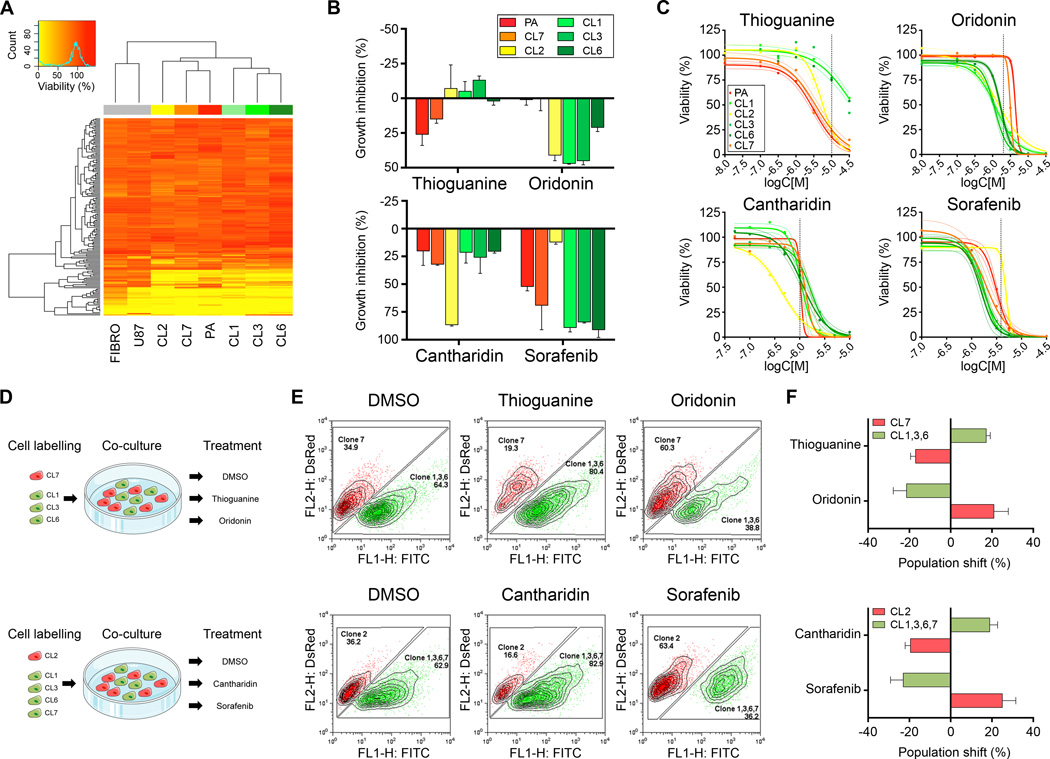
Figure 4.
Distinct pharmacological response patterns enable selection of subclones by in vitro drug challenge. (A) The ‘Killer Plates’ collection was applied (1 µM, each) to record pharmacological responses of GNV019 cell samples. The heatmap illustrates unsupervised clustered viability values (FIBRO, human fibroblasts; U87, glioma cell line; PA, GNV019 parental cells). (B) Subset of data from Fig. 4A, including Sorafenib (applied at 3.16 µM) from set of pilot screening data, suggesting candidate compounds for pharmacological selection of GNV019 subclones. Growth inhibition determined from viability analysis. (C) Dose response curves of candidate compounds. Colored dashed lines indicate the 95% confidence interval of the non-linear regression curve. Dashed vertical lines indicate drug concentrations chosen for further pharmacological selection studies. (D) Experimental co-culture paradigm. For each experiment, equal amounts of red vs. green pre-labeled GNV019 subclones were mixed and exposed to the indicated compounds. (E) At 5 days after exposure at least 15,000 co-cultured cells were quantified by FACS analysis. Shown are representative plots indicating drug-induced shifts of population size among pre-labeled subclones in co-culture. (F) Graphs depict the respective population shifts as calculated by subtracting the percentage of the DMSO-treated control cells from the drug-treated cells (n=3 experiments, each).

