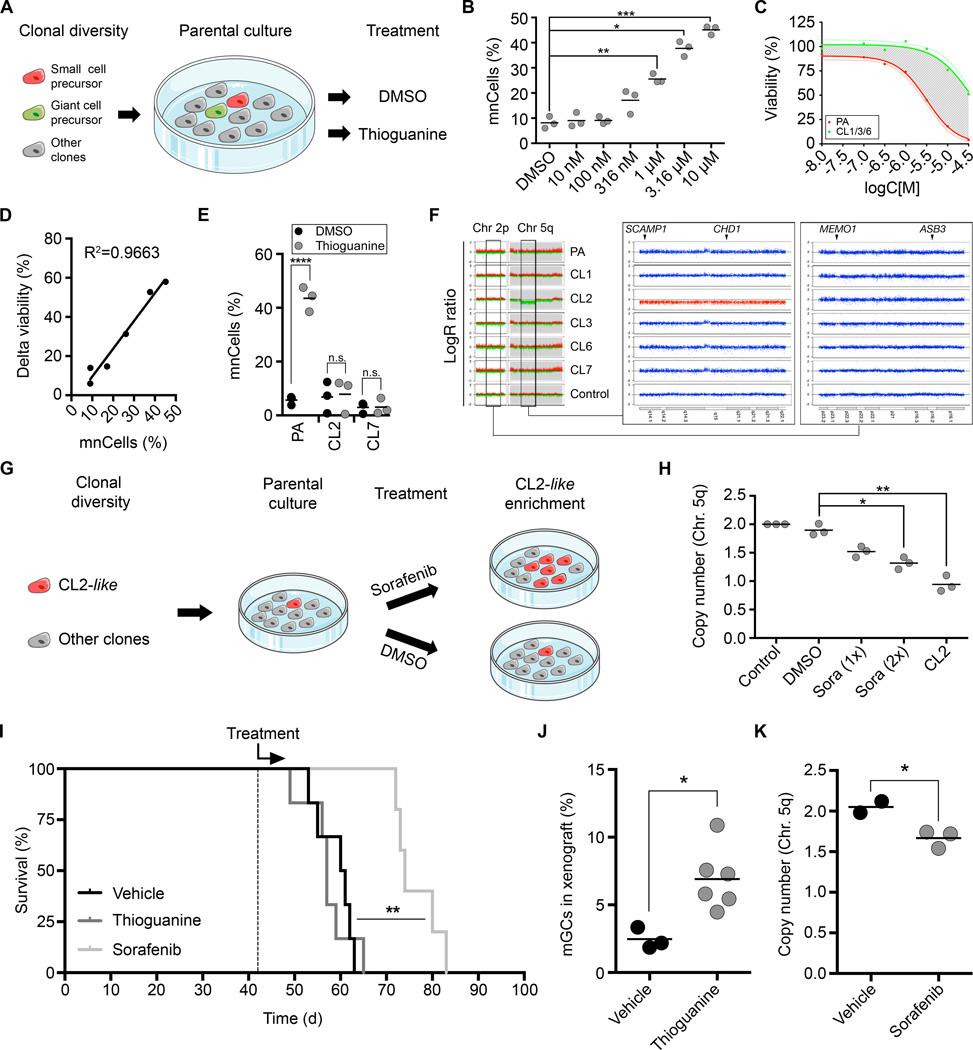
Figure 5.
Intra-tumoral, treatment-related population dynamics can be predicted in vitro (A–H) and in vivo (I–K). (A) Paradigm using GNV019 parental cells for subclone enrichment experiments. (B) Graph depicts rise of (giant) multinucleated cell (mnCells) frequencies in response to increasing concentrations of Thioguanine (5-day-treatment plus 4-day-differentiation). Quantification based on counting 306±117 cells per condition (n=3 experiments, each). (C) Dose-response-curve on GNV019 parental cells vs. mean values from CL1/3/6 cells. Shaded area highlights difference between both curves (delta viability). (D) Linear regression analysis correlating mnCell frequencies (from Fig. 5B) with delta viability (from Fig. 5C). (E) Graph showing drug effects on CL2/7 cells vs. GNV019 parental cells. Quantification of mnCells based on counting 674±428 cells per condition (n=3 experiments, each). (F) LogR ratio plot (scale −2/+2) of CL2-specific deletion (middle panel, red: 5q14.1-q22.1). For qRT-PCR DNA copy number analysis primers were designed for intra (SCAMP1/CHD1) and extra (Chr. 2p23.2-16.1)-deletion genes (MEMO1/ASB3) as indicated. (G) Paradigm using GNV019 parental cells for subclone enrichment experiments: Sorafenib (4 µM) or DMSO (0.02%) was applied for 5 days (1–2 cycles) followed by DNA isolation for copy number quantification. (H) Graph depicts respective copy number quantification data, normalized using normal human leukocyte DNA (n=3 experiments, each). (I) Kaplan-Meier graph illustrating initiation of treatment (dashed line) and survival times of animals xenotransplanted with GNV019 parental cells. Note, the graph combines survival statistics for NaOH and Kolliphor/EtOH-vehicle controls. Shown level of significance reflects Mantel-Cox test results for Sorafenib- vs. Kolliphor/EtOH-treated animals. (J) Graph depicts blinded quantification of mGCs in vehicle (0.02 M NaOH, n=3) vs. Thioguanine (3×10 mg/kg, n=6)-treated animals sacrificed at the end of the experiment. (K) Graph depicts qRT-PCR DNA copy number analysis conducted in analogy to Fig. 5H. Microdissected tissue derived from animals treated with Sorafenib (100 mg/kg, n=3) was compared with tissue from Kolliphor/EtOH-treated (12.5%/12.5% in ddH2O, n=2) animals. Significance levels: *p<0.05; **p<0.01; ***p<0.001; ****p<0.0001; n.s., not significant.

