Figure 6.
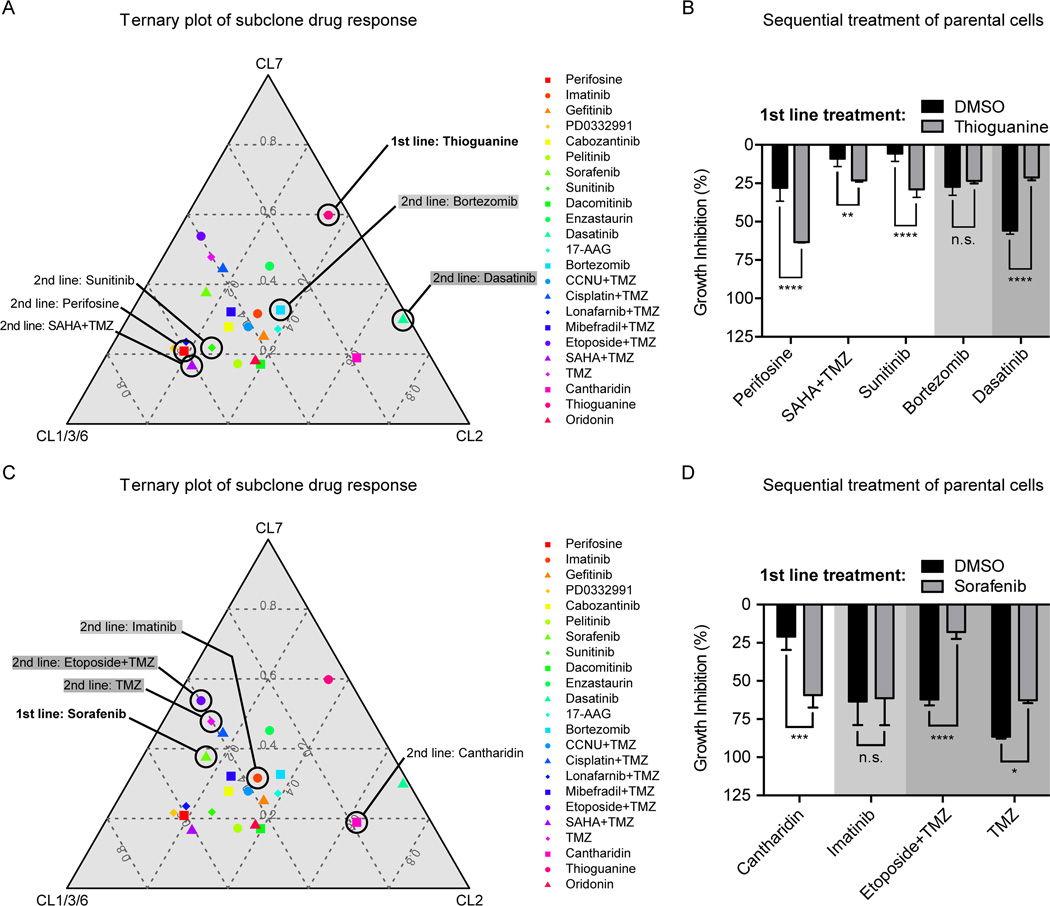
Implications of predictable population dynamics for 2nd line treatment strategies. (A) Ternary plots visualize the pharmacological profiling data of the three GNV019 hierarchies in a two-dimensional plot (IC50 values, average data for CL1/3/6; comp. Fig. 1, 4C, Supplementary Fig. S1). Every data point represents the positioning of a tested drug in relation to the respective cellular hierarchies. A drug that plots in close proximity to an edge in the graph has a strong inhibitory effect on the respective hierarchy and little effects on the others. Increasing distance from a corner implies decreasing sensitivity of the drug toward the respective hierarchy. For the first line setting of Thioguanine-based enrichment of CL1/3/6-like cells, 2nd line drugs were chosen as indicated in the plot: Sunitinib, Perifosine, and SAHA+TMZ plotted close to the CL1/3/6 hierarchy, thus predicted highly effective sequential partners. Bortezomib (light gray) and Dasatinib (dark gray) were predicted less effective. (B) Investigations on GNV019 parental cells: graph representing data from sequential application of Thioguanine/DMSO followed by the chosen drugs from (Fig. 6A). Note the high consistency of predictions on effectiveness of 2nd line drug applications. (C) For the first line setting of Sorafenib-based enrichment of CL2-like cells, 2nd line drugs were chosen as indicated in the plot: Cantharidin plotted close to the CL2 hierarchy, thus predicted a highly effective sequential partner. Imatinib (light gray) and TMZ / Etoposide+TMZ (dark gray) were predicted less effective. (D) Investigations on GNV019 parental cells: graph representing data from sequential application of Sorafenib/DMSO followed by the chosen drugs from (Fig. 6C). Note the high consistency of predictions on effectiveness of 2nd line drug applications. Experiments performed in triplicates. Significance levels: *p<0.05; **p<0.01; ***p<0.001; ****p<0.0001; n.s., not significant.

