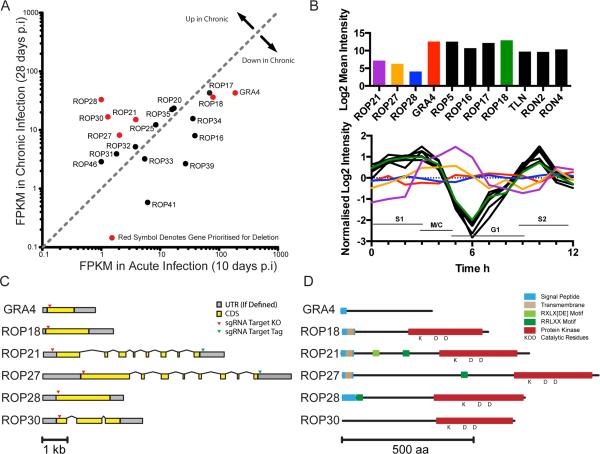
Figure 1.
Bioinformatic Profiling of ROPKs. Expression and transcript data were analyzed to identify candidate ROPKs for further study. A. RNAseq data (Pittman et al., 2014) compares ROPK expression levels in acute and chronic infections of C57bl/6 mice with ME49 parasites. Genes upregulated in chronic phase and/or selected for knockout are marked in red. B. Cell cycle microarray data (Behnke et al., 2010) of asynchronous RH tachyzoites (upper) plotted as mean expression levels, and synchronized RH tachyzoites (lower) plotted as expression level change during the cell cycle. Dotted lines S1, M/C, G1 and S2 mark cell cycle stages. (Note: data were not available for ROP30). C. Predicted gene models for selected ROPKs and GRA4 control. UTRs are marked in grey and exons are marked in yellow. Arrowheads denote the location of sgRNA target sites used in CRISPR/Cas9 knockout and tagging strategies. D. Predicted domain architecture of selected proteins, based on PFAM motifs, TMHMM, and motif search in CLC Genomics Workbench. Conserved residues predicted in active protein kinases are marked with KDD.

