Figure 5.
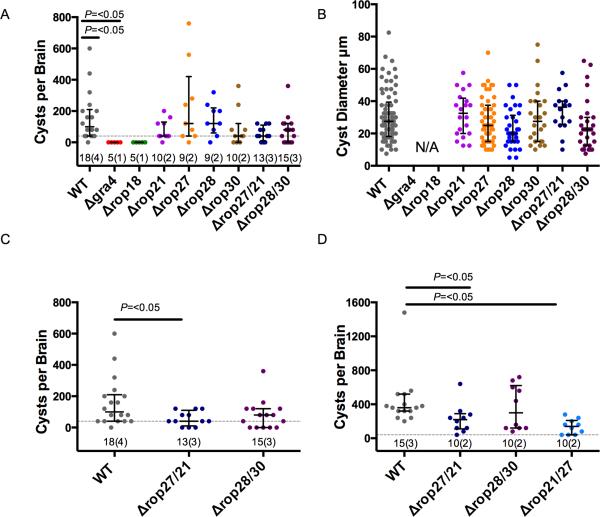
Analysis of Knockout Parasites. A. Brain cyst burdens of C57BL/6J mice at 30 days post infection. Lines and error bars denote the median and interquartile range, data were analysed using Kruskal-Wallis test with Dunn's multiple comparison correction. Dotted line indicates the limit of detection in this assay and the numbering below each group denotes total number of animals analysed followed by the number of experiments performed in parentheses (numbering is similar in C, and D). B. Diameter of cysts from C57BL/6J mice at 30 days post infection. Error bars denote the median and interquartile range of samples. C. Brain cyst burden of C57BL/6J at 30 days post infection showing data from A. for double-knockouts only. Data were analysed by pairwise Mann-Whitney U test, error bars denote median and interquartile range. D. Brain cyst burden of CBA/CaJ mice at 30 days post infection with double-knockout parasites. Lines and error bars denote median and interquartile range, data were analysed by pairwise Mann-Whitney U test.

