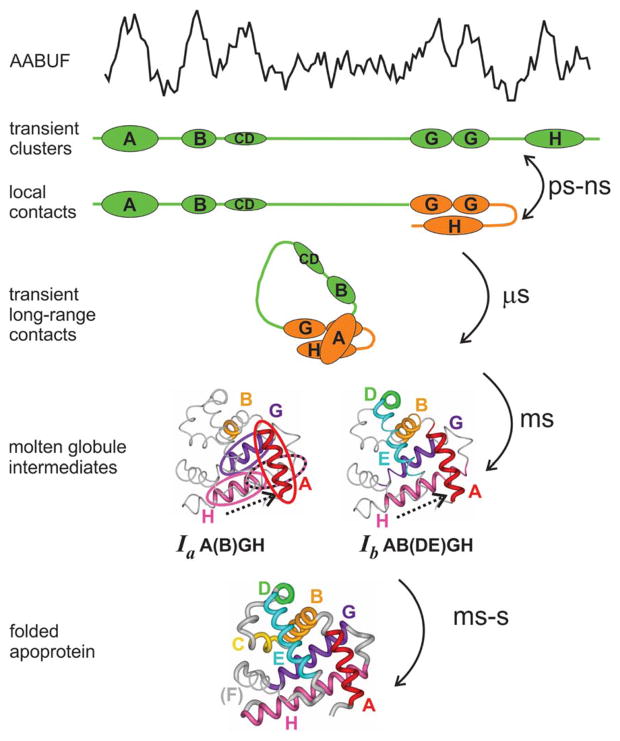
Figure 4.
Schematic diagram of the apomyoglobin folding pathway. The AABUF profile (top of figure) shows peaks where the amino acid sequence indicates local clusters of hydrophobic residues and side chains such as Lys and Glu that contain long aliphatic regions in their side chains. Local interactions between the G and H helices and transient long-range interactions between the A and G/H regions are observed in the acid-unfolded state. The molten globule intermediate Ia is the first observable state, with stabilized helical structure and patterns of protected amide protons that indicate that the H helix is translocated (indicated by arrow and dotted ellipse). The H helix is also translocated in intermediate Ib, which contains more protected amides in the D and E helices, indicating that these helices are partly folded. After a few seconds, the final folded state forms, with all of the helices except F correctly folded and packed.

