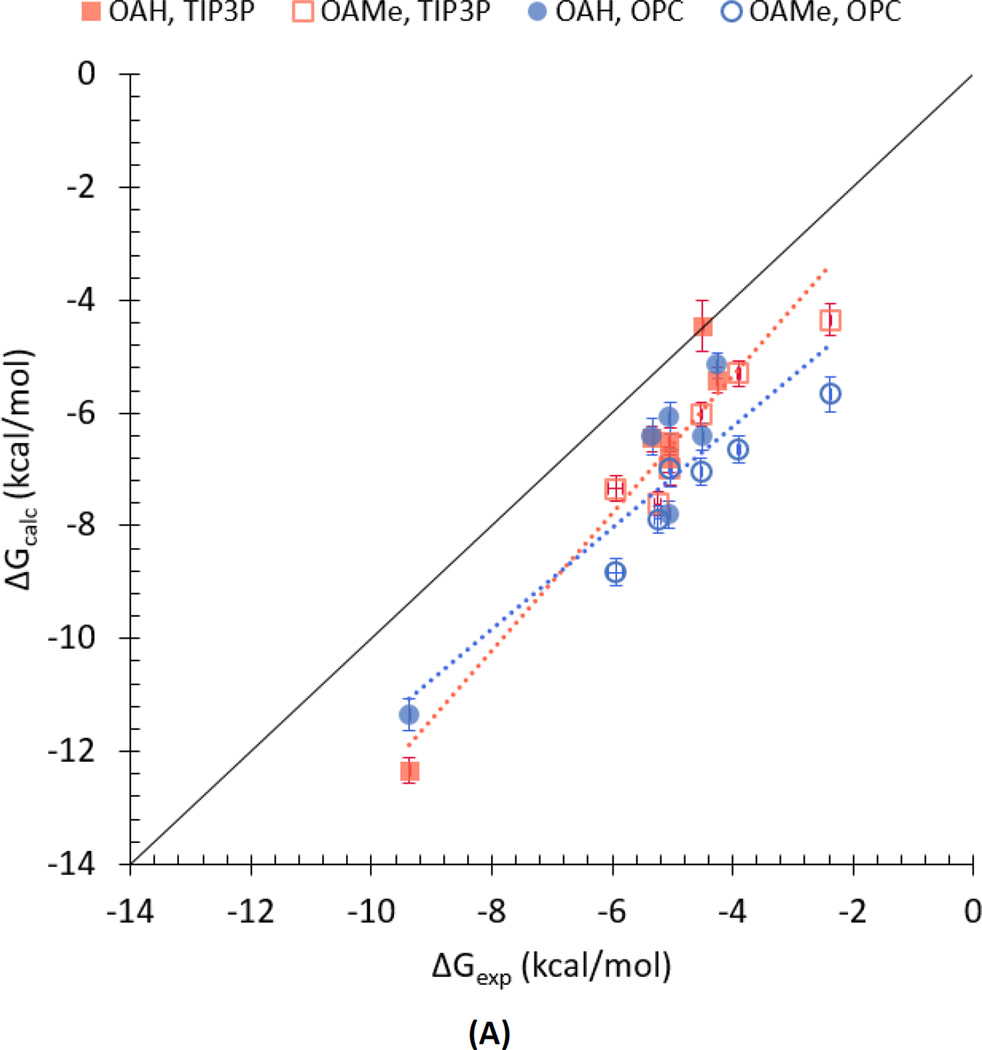
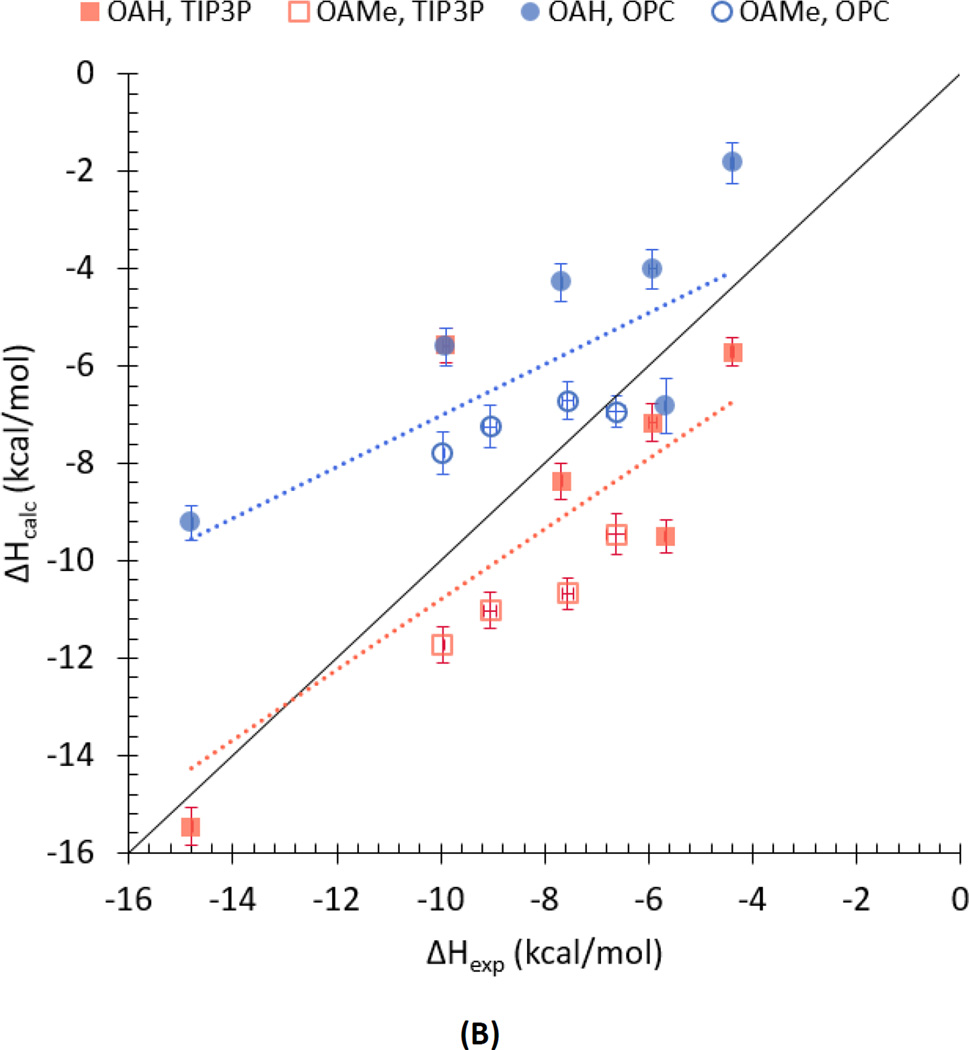
Fig 3.
Scatter plots of computed versus experimental (A) binding free energies and (B) binding enthalpies for the combined OAH (filled symbols) and OAMe (open symbols) datasets. The corrected binding affinities are plotted for OAH-G5 and OAMe-G4 systems. Red squares: TIP3P results; blue circles: OPC results. Horizontal bars indicate the experimental uncertainties (SEM) although some of them are too small to be visible. Vertical bars indicate the computational uncertainties (SEM). Solid black line is the line of identity.


