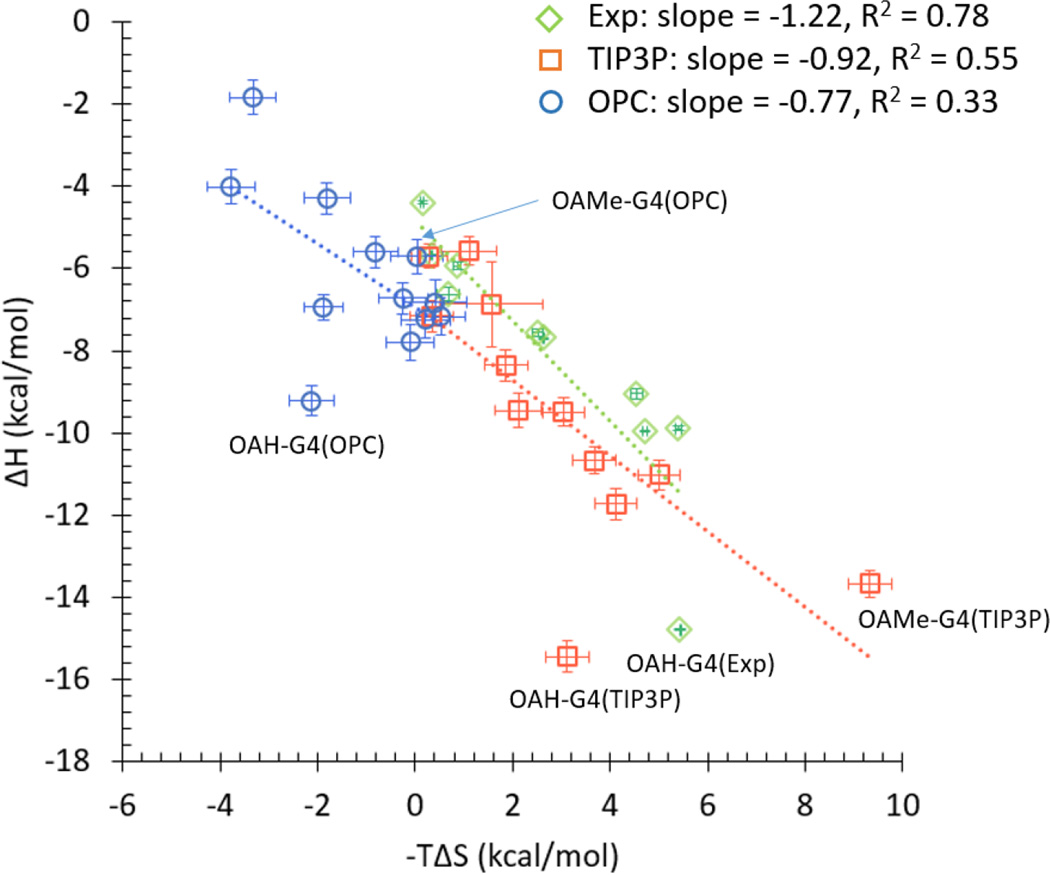
Fig 4.
Scatter plots of binding enthalpy versus the entropic contribution to the free energy, for the combined OAH and OAMe dataset. The corrected binding thermodynamics are plotted for the OAH-G5 system. Green diamonds: experimental values (exp.); red squares: TIP3P data; blue circles: OPC data. Vertical and horizontal bars indicate the uncertainties for ΔH and −TΔS, respectively. Solid black line is the line of identity. Note that experimental binding enthalpies are not available for OAMe-G4 and OAMe-G5.

