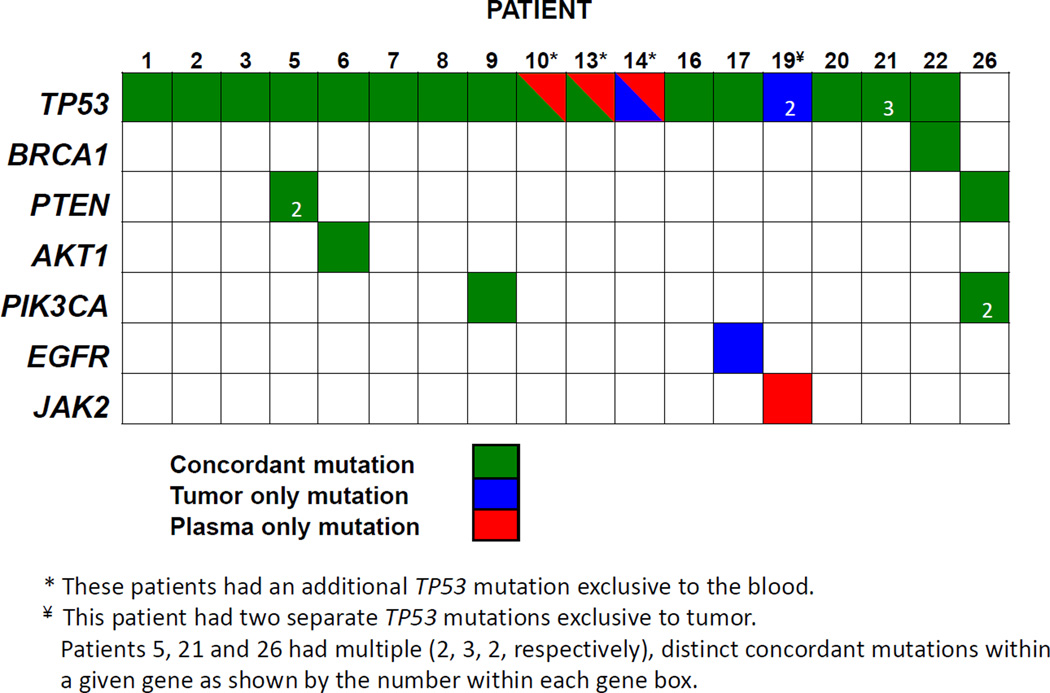
Figure 2. Plasma and tumor mutation concordance.
Shown are concordance between mutations found in tumor tissue and mutations found in a paired blood samples. Copy number alterations were not performed on blood samples and were therefore not analyzed. Concordance between tissue and blood for a given mutation is represented in green, while mutations found exclusively in tissue or blood are represented as blue and red, respectively. Patients 5, 21 and 26 had multiple distinct mutations within a given gene with the number of mutations shown for each gene (2 for PTEN, 3 for TP53, 2 for PIK3CA, respectively). Three patients had additional, separate TP53 mutations found only in blood (*), while one patient had two separate TP53 mutations found only in tumor (¥).

