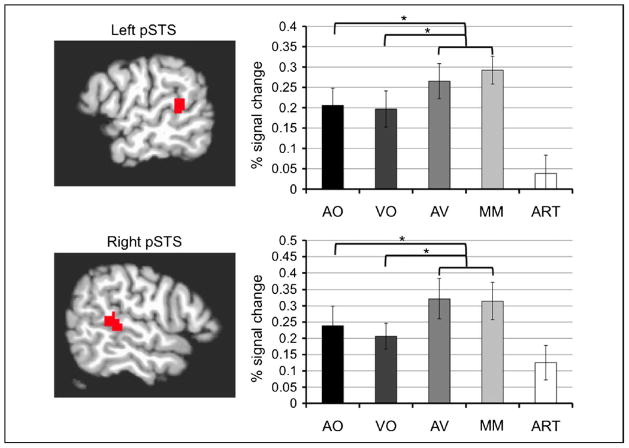
Figure 6.
Analyses of pSTS ROIs from Experiment 2. (top) Left pSTS ROI localized through a conjunction of AO and VO trials during even experimental runs. Percent signal change values from odd runs for each condition within the ROI are reported in the bar graph to the right. The contrast AO: −2 VO: 0 AV: 1 MM: 1 ART: 0 revealed that the multisensory conditions (AV and MM) produced significantly greater activity than AO, F(l, 19) = 6.045, p = .024, and the contrast AO: 0 VO: −2 AV: 1 MM: 1 ART: 0 revealed that the multisensory conditions (AV and MM) produced marginally significantly greater activity than VO, F(1, 19) = 4.748, p = .042. (bottom) Right pSTS ROI localized through the conjunction of AO and VO trials during even experiment runs. Percent signal change values from odd runs for each condition within the ROI are reported in the bar graph to the right. The contrast AO: −2 VO: 0 AV: 1 MM: 1 ART: 0 revealed that the multisensory conditions (AV and MM) produced significantly greater activity than AO, F(1, 19) = 6.045, p = .025, and the contrast AO: 0 VO: −2 AV: 1 MM: 1 ART: 0 revealed that the multisensory conditions (AV and MM) produced marginally significantly greater activity than VO F(1, 19) = 4.748, p = .030. Error bars indicate standard error for each condition. All reported contrasts are Bonferroni corrected for multiple comparisons with a family-wise error rate of p < .05 (per-comparison error rates of p < .025).

