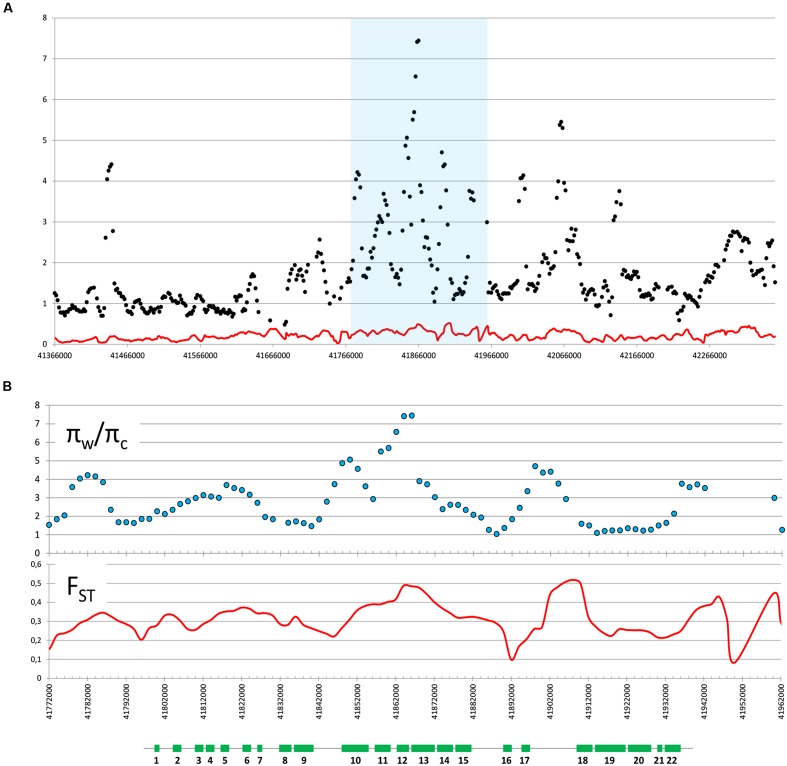
FIGURE 2.
Wild/cultivated nucleotide diversity ratio (πw/πc) and pairwise population differentiation (FST). πw/πc (dots) and FST (red line) are graphed on carrot chromosome 2 centered around the cult polymorphic site in a 1 Mb (A) or 200 Kb (B) region (highlighted blue in A). Both parameters were calculated as average for sliding windows of size = 10 Kb and shift = 2 Kb. Schematic representation of genes (green rectangles) in the analyzed region is shown below graphs in panel B. Genes are numbered as in Table 2.

