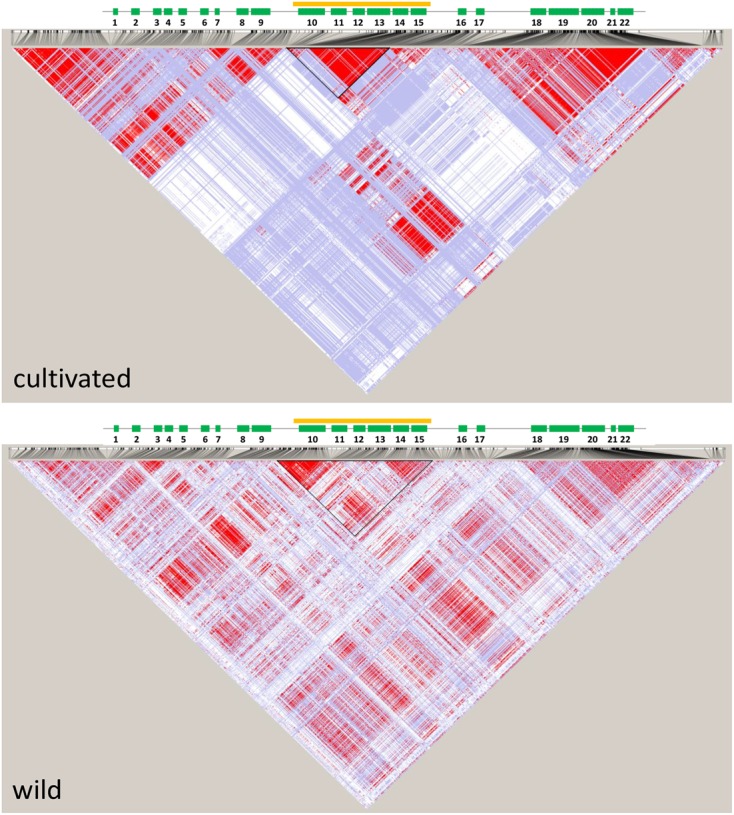
FIGURE 3.

Linkage disequilibrium (LD) plots of a 200 Kb region of carrot chromosome 2 centered around the cult polymorphic site for the cultivated and wild genomes. Localization of genes is shown above (green rectangles), genes are numbered as in Table 2. The orange line and outlined triangle shows the region under selection.
