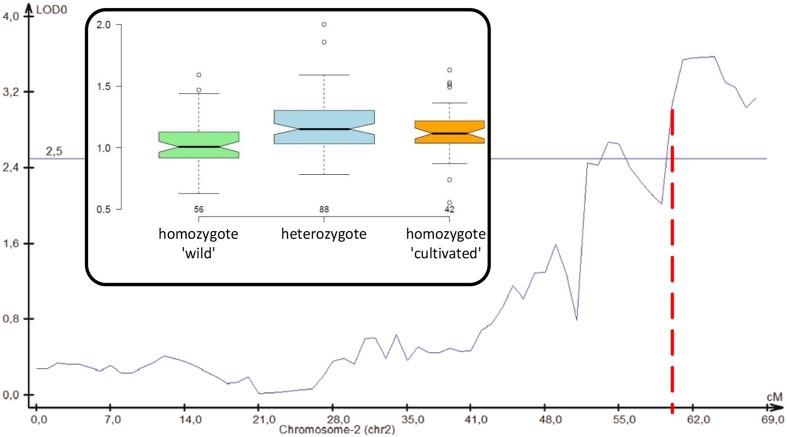
FIGURE 6.
Position of a QTL for root thickening on carrot chromosome 2. Genetic distance is shown on the X-axis, LOD is on the Y-axis, thin horizontal line shows the significance threshold, red dashed vertical line shows the position of DcAHLc1. Inset: a boxplot presenting arm to crown ratio distributions in plants with respect to the cult marker variant.

