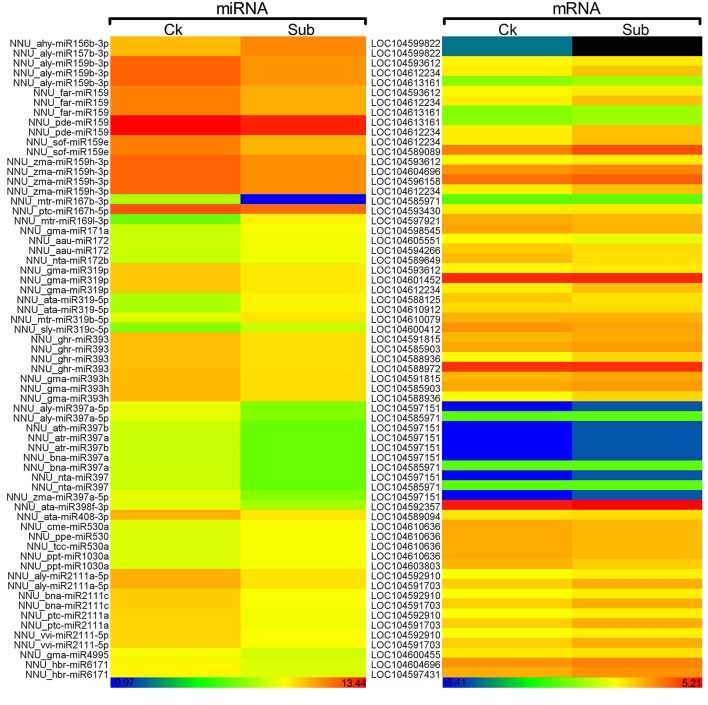
Figure 5.
Heat map of expression of submergence-responsive miRNAs and corresponding target genes which were validated by degradome and transcriptome. Color scale represents normalized log2 transformed counts. Blue indicates low expression and red indicates high expression. Black indicates the genes that were not been detected.

