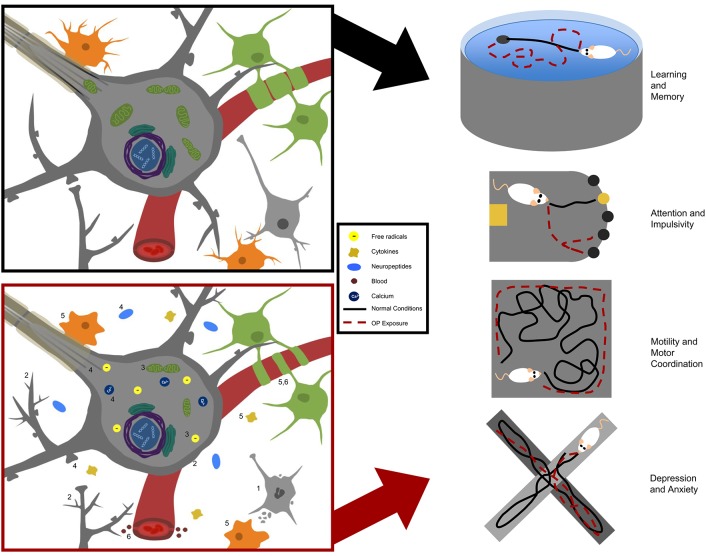
Figure 1.
Summary of neurotoxic effects in experimental models of occupational OP exposures. Molecular manifestations are summarized on the left with normal physiological conditions in the black box and OP-induced effects in the red box. Numbers in the lower box correspond to numbers for specific endpoints identified in Table 6. Behavioral outcomes identified in animal models of occupational OP exposure are summarized on the right with black lines indicating normal behavior and red dashed lines indicating altered responses in OP-exposed animals.

