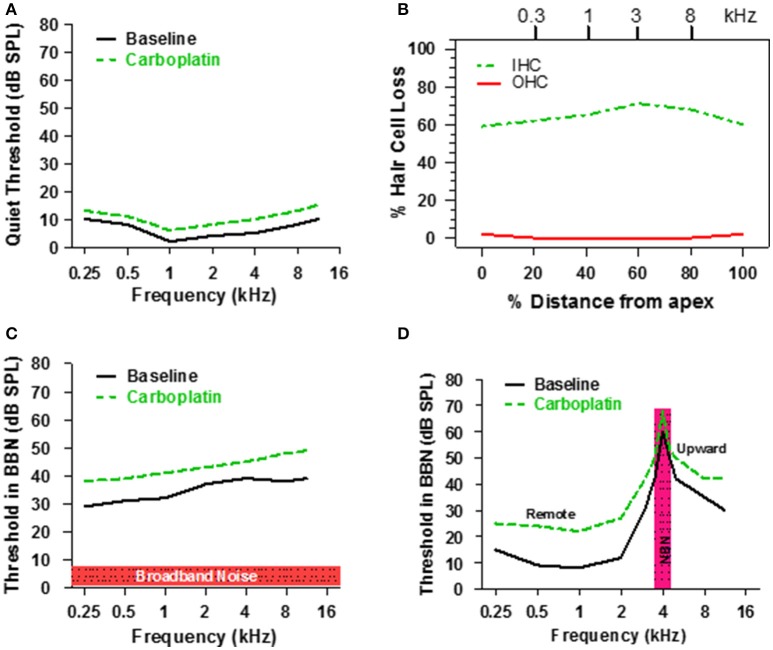
Figure 8.
(A) Schematic illustrating threshold in quiet before and after a moderate dose of carboplatin. (B) Schematic representing the IHC and OHC loss after a moderate dose of carboplatin that induces a 60–70% IHC with little or no loss of OHC. (C) Schematic showing the threshold in 50 dB SPL broadband noise before and after moderate dose of carboplatin. (D) Schematic illustrating the thresholds measured in narrowband noise (100 Hz bandwidth) centered at 4 kHz before and after a moderate dose of carboplatin. Carboplatin-induced threshold elevations above 4 kHz reflect the upward spread of masking and those below 4 kHz reflect remote masking. Data schematized from Lobarinas et al. (2016).

