Figure 1.
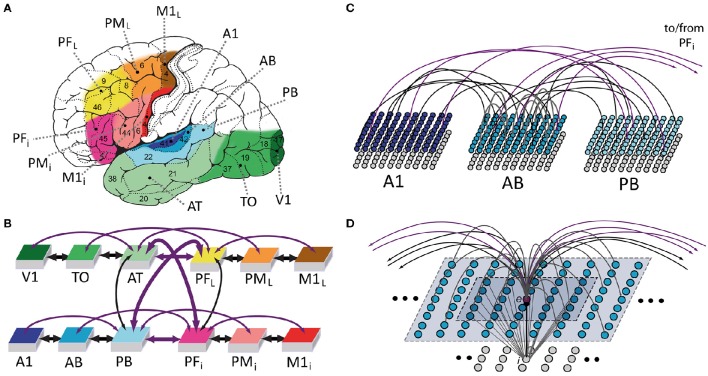
Model of lexical and semantic mechanisms: the 12 cortical areas simulated (A), their global connectivity architecture (B), aspects of between- (C) and within-area (D) connectivity of model neurons are illustrated. (A) Six perisylvian and six extrasylvian areas are shown, each including an anterior (frontal) and a posterior (temporal) part. Perisylvian areas include three areas in inferior frontal gyrus (colored in different shades of red), including inferior-prefrontal (PFi), premotor (PMi), and primary motor cortex (M1i) and three areas in the superior temporal lobe (shades of blue), including auditory parabelt (PB), auditory belt (AB), and primary auditory cortex (A1). These areas are relevant for storing and linking up articulatory-phonological and corresponding acoustic-phonological patterns of neuronal activations, which co-occur, for example, when spoken word forms are being articulated (activity in M1i) and corresponding speech sounds are simultaneously perceived (stimulation of primary auditory cortex, A1). Extrasylvian areas include three areas in lateral/superior frontal cortex (yellow to brown), including dorsolateral prefrontal (PFL), premotor (PML), and primary motor cortex (M1L) and three areas forming the occipito-temporal (“what”) visual stream of object processing (different shades of green), including anterior-temporal (AT), temporo-occipital (TO), and early visual areas (V1). These areas contain neural patterns carrying semantic information (word meaning), for example when words are used (activity in all perisylvian areas) to talk about objects present in the environment (activity in V1, TO, AT) or about actions currently being performed (activity in M1L, PML, PFL). Numbers indicate Brodmann Areas (BAs). (B) Schematic illustration of the 12 modeled areas and between-area connections implemented (shown as bidirectional arrows). The colors indicate the correspondence between cortical and model areas. Thick and thin arrows indicate links already implemented in previous mean-field versions of the architecture and newly added ones, respectively. Arrow color discriminates “next-neighbor” connections (in black), linking cortically adjacent areas, from “jumping” ones (in purple), between non-adjacent cortical areas. See main text for the neuroanatomical evidence used to determine the model's connectivity structure. (C) Schematic illustration of connectivity between three areas of the model. Each area consists of two layers (or banks) of 25 × 25 excitatory (upper) and inhibitory (lower) integrate-and-fire cells exhibiting neuronal fatigue. Between-area connections (black and purple) are sparse, random and topographic. (D) Neuron-level connectivity of one of the 7500 single excitatory neural elements modeled (labeled “e”). Within-area excitatory links (in gray) to and from “cell” e are random and sparse, and limited to a local (19 × 19) neighborhood of neural elements (area shaded in light-blue). Lateral inhibition between e and neighboring excitatory elements is realized as follows: the underlying cell “i” inhibits e in proportion to the total excitatory input it receives from the 5 × 5 neighborhood (darker-blue shaded area); by means of analogous connections (not depicted), e inhibits all of its neighbors.

