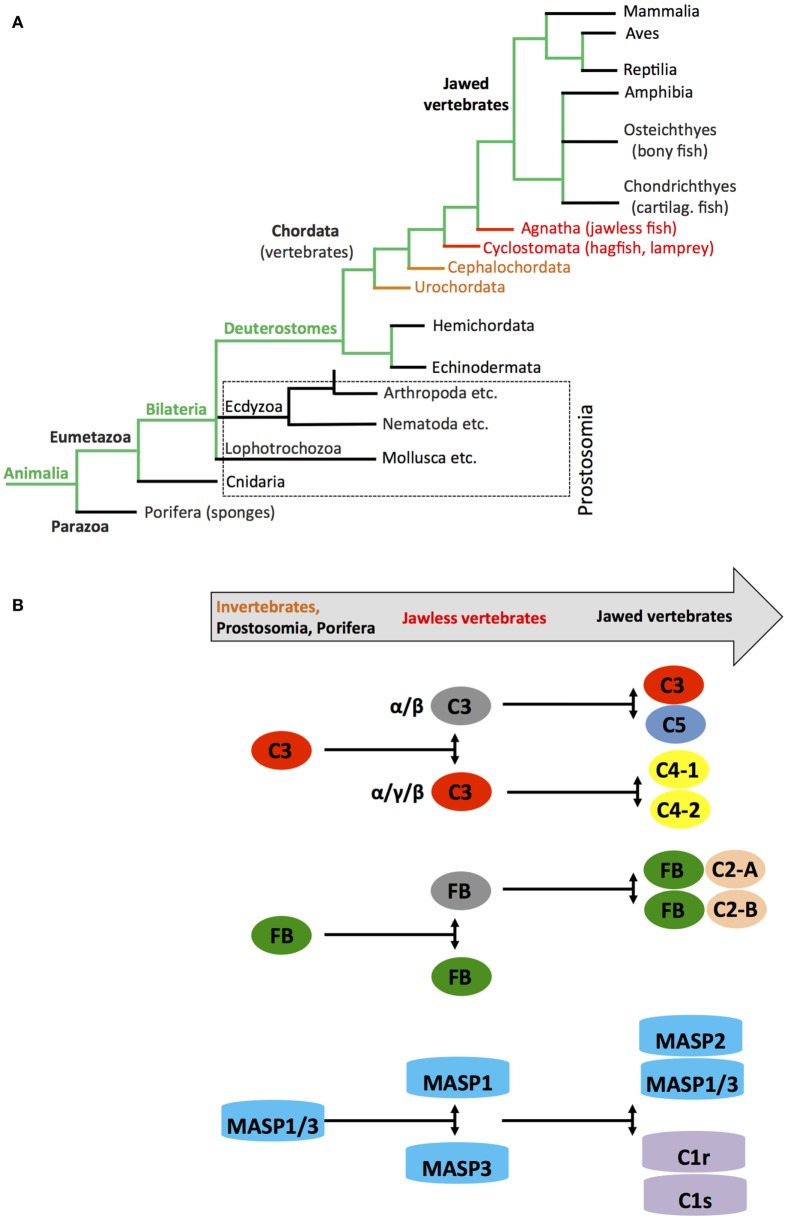
Figure 5.
Schematic depicting appearance of the “original” complement components during evolution. (A) Simplified phylogenic tree of species with emphasis on families and species important during evolution of the complement system (see text). (B) Cartoon depicting the appearance of complement(s) C3/C4/C5, factor B (FB), and earliest members of the MASP families during evolution. Color coding in the “title arrow” corresponds to specific key species in the phylogenetic tree under (A). Note that the appearance of fully functional TTC/MAC components and complement receptors and regulators are not depicted in this schematic.

