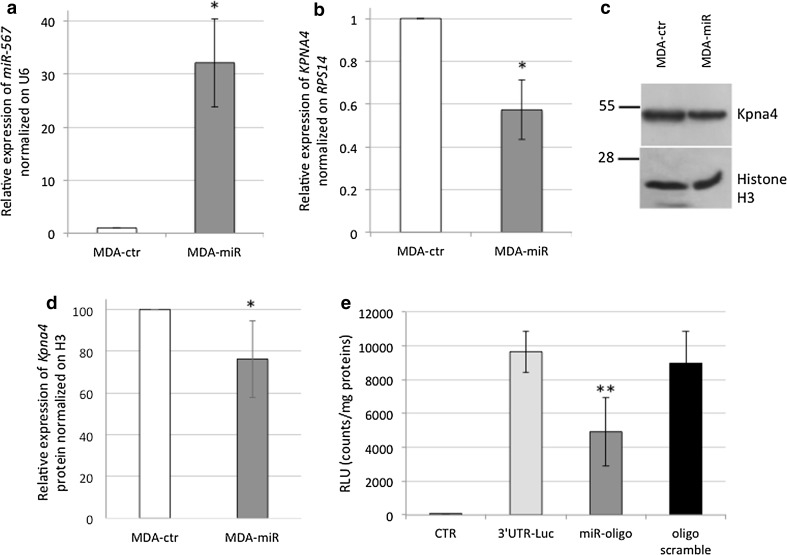
Fig. 3.
a Relative expression of miR-567 normalized on U6 in MDA-ctr cells (in white) versus MDA-miR (in gray). All data are presented as mean ± SD of experiments for each bar (*t test p value = 0.02, n = 9). b Relative expression of KPNA4 normalized on RPS14 in MDA-ctr cells (in white) versus MDA-miR (in gray) cell lines, respectively. All data are presented as mean ± SD of experiments for each bar (*t test p value = 0.012, n = 9). c Western Blot of KPNA4 protein and Histone H3, used as normalizing protein. d Western Blot quantification of KPNA4 protein normalized on Histone H3 in MDA-ctr (in white) and MDA-miR (in gray) cells. All data are presented by mean ± SD of experiments for each bar (*t test p value = 0.05, n = 6). e Luciferase assay results are depicted in the graph. The relative luminescence activity (RLU) has been normalized on total protein content for each sample. CTR: untreated MDA-MB-231; 3′UTR: MDA-MB-231 transfected with pMirTarget vector containing 3′UTR of hKPNA4 sequence; 3′UTR + miRNA: MDA-MB-231 transfected with pMirTarget vector containing 3′UTR of hKPNA4 sequence, in combination with 100 nM mimic miR-567 oligonucleotide; 3′UTR + scramble: MDA-MB-231 transfected with pMirTarget vector containing 3′UTR of hKPNA4 sequence, in combination with 100 nM scramble oligonucleotide. All data are presented as mean ± SD of experiments for each point (**t test p value = 0.0013, n = 3)

