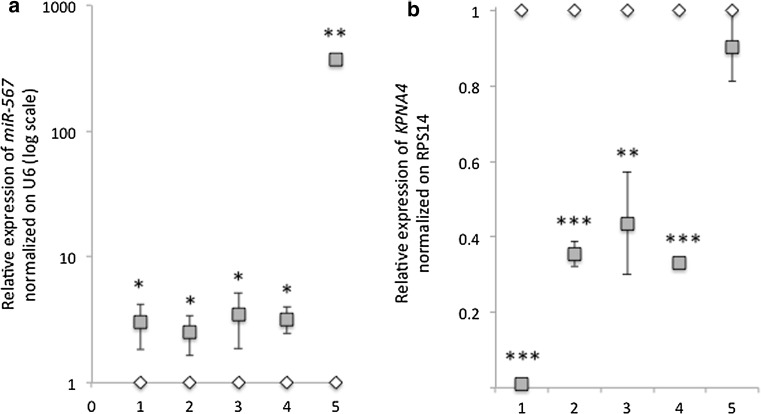
Fig. 6.
a Relative expression (log scale) of miR-567 normalized on U6 on five explanted tumors formed by MDA-miR + luc (in gray) or MDA-ctr + luc (in white) cells, respectively. All data are presented as mean ± SD of experiments for each tumor (1–5) (t test *p value < 0.05; **p value < 0.01, n = 9). b) Relative expression of KPNA4 normalized on RPS14 on five explanted tumors (1–5) formed by MDA-miR + luc (in gray) or MDA-ctr + luc (in white) cells, respectively. All data are presented as mean ± SD of experiments for each tumor (t test **p value < 0.05; ***p value < 0.001, n = 9)

