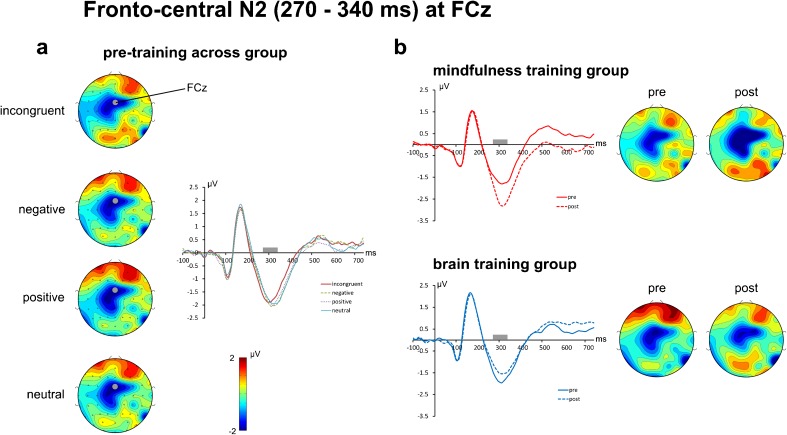
Fig. 3.
Event-related potentials (at electrode FCz) and spherical spline interpolated scalp topographies of the fronto-central N2 potential. The left panel (a) shows the scalp topographies for T1 (pre-training) averaged across meditation and brain training group. A clear N2 component captured in a time window from 270 to 340 ms post-stimulus (indicated by the gray bars in the ERP plots) and centered on electrode FCz is clearly visible. The right panel (b) shows the changes of the N2 from pre-training (solid line) to post-training (dashed line) for both groups

