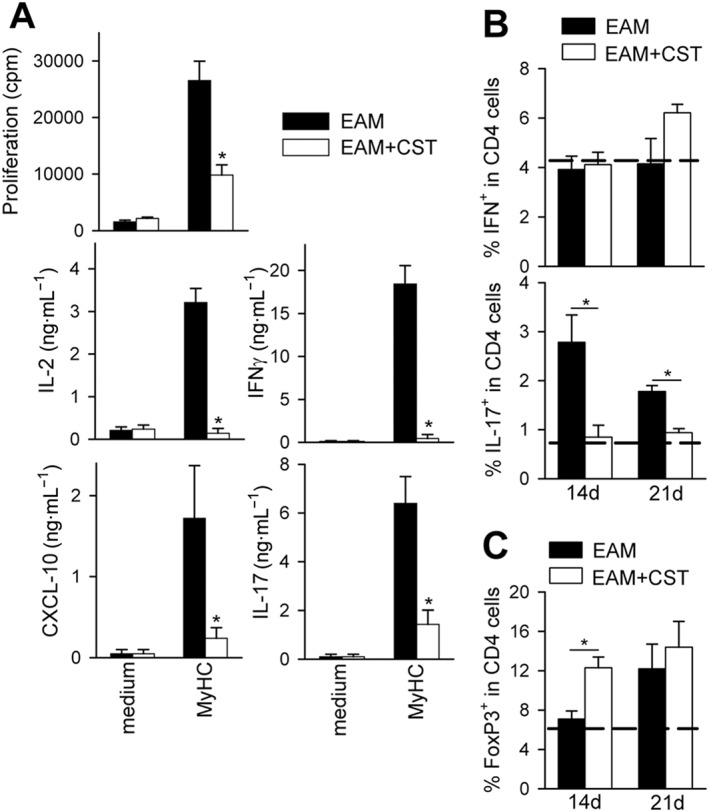
Figure 6.

Treatment with cortistatin impairs cardiomyogenic T‐cell responses in vivo. Mice with MyHC614–629‐induced EAM were treated i.p. with PBS (EAM) or cortistatin (EAM + CST) three times per week for 2 weeks. (A) At day 21, DLN cells were isolated. Proliferation and cytokine production by DLN cells cultured in medium or restimulated with MyHC614–629 was determined. We obtained similar results when splenocytes were analysed. n = 10 mice per group, performed in two independent experiments. *P < 0.05 versus untreated EAM mice. (B) Flow cytometric analysis of intracellular cytokines in the CD4 population of activated DLN cells isolated at days 14 and 21 after EAM induction. n = 8–12 mice per group, performed in three independent experiments. (C) Flow cytometric analysis of CD25+FoxP3+ T cells in gated CD4+ cells of DLN cells isolated 14 and 21 days after EAM induction. Representative dot plots are shown in Figure S6. Dashed lines in (B and C) represent values obtained with DLN cells isolated from naïve mice. n = 8 mice per group, performed in two independent experiments. *P < 0.05.
