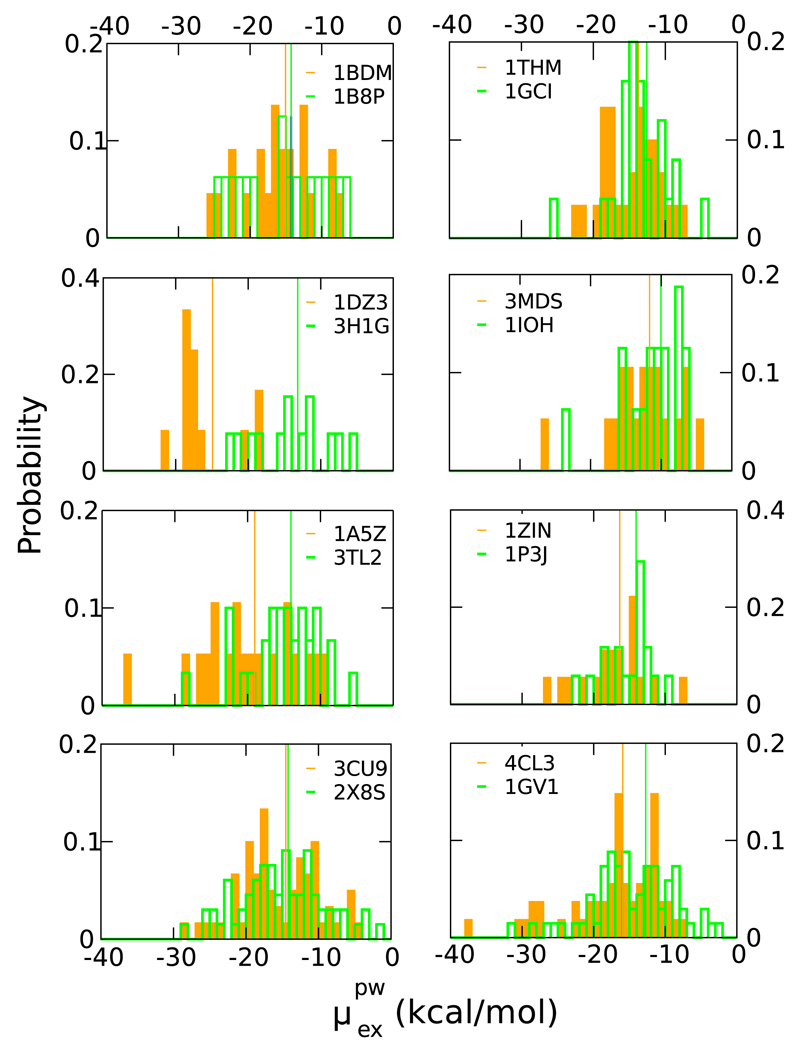
Figure 3.
Probability distribution of the excess chemical potential due to the interactions between the water molecule and the protein as calculated via the Gaussian approximation. Each panel refers to a different pair of thermophilic/mesophilic homologues. Data for the mesophiles are in green, data for the thermophiles are in orange.The average value are indicated by the vertical lines. All averages are lower than the bulk estimate for reporting an average favourable internal hydration.

