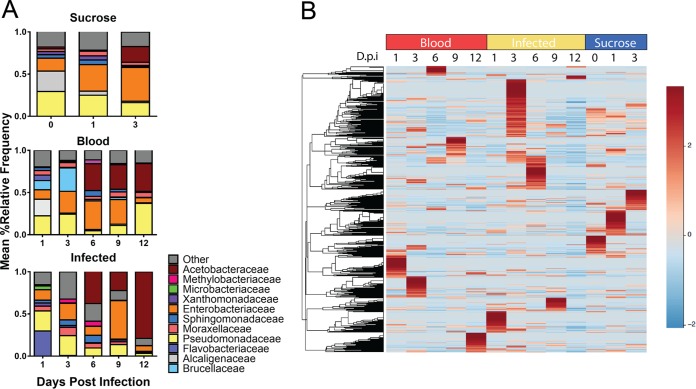
FIG 2 .
Temporal variation in the relative abundances of midgut OTUs. (A) Bar graphs represent the relative abundances of family-level OTUs in sand flies under each condition. OTUs representing >5% of the overall relative abundance under at least one condition are shown; OTUs that remained at less than 5% of the overall abundance under all conditions are pooled as “other.” (B) A heat map of species-level OTUs over time in all treatment groups, clustered by Euclidean distances, is shown. Data for days 0 to 9 are representative of three independent experiments; data for day 12 are from two independent experiments. Sequence data were obtained from the same 3 experiments described for Fig. 1.

