FIG 1 .

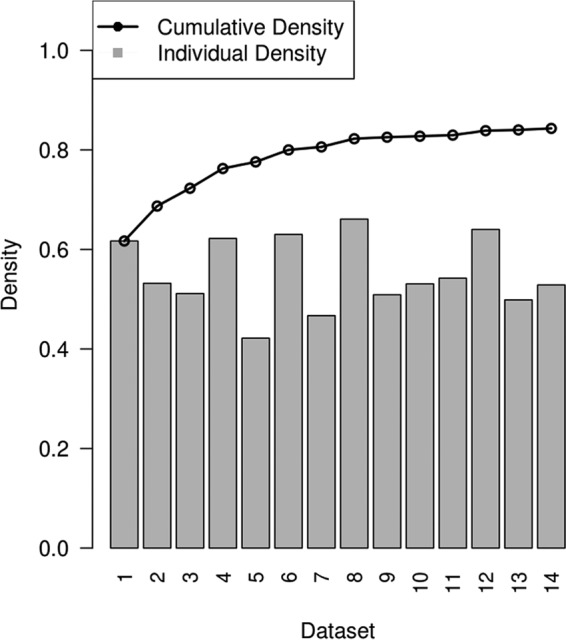
Cumulative fraction of TA sites represented as independent TnSeq data sets (black line). The gray bars show the saturation level of the individual data sets.

Cumulative fraction of TA sites represented as independent TnSeq data sets (black line). The gray bars show the saturation level of the individual data sets.