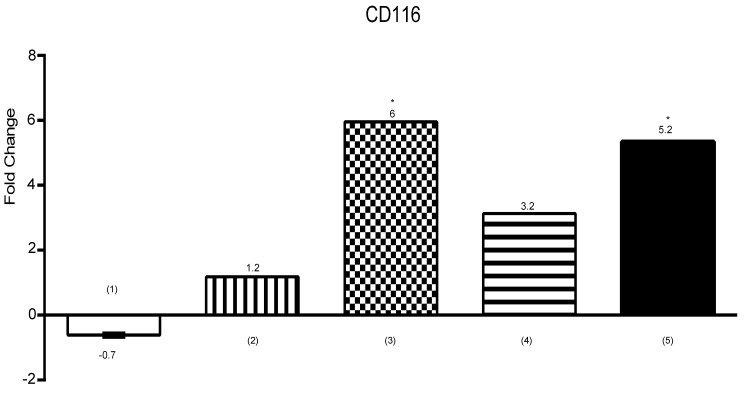
Figure 6.
Expression of CD116 by U937 cells is shown on the diagram. Expression was analyzed by using RT-PCR. (1) U937 cells+UCB-MSCs, (2) U937 cells in C.M, (3) U937 cells+100μM CoCl2, (4) U937 cells+UCB-MSCs+100μM CoCl2, (5) U937 cells in C.M+100μM CoCl2. ns, non-significant. (*P<0.05, by using student’s t-test).

